Wall Street Memes (WSM/USD) Trades Boost Up, Making Moves
Estimated Reading Time: 4 minutes
Don’t invest unless you’re prepared to lose all the money you invest. This is a high-risk investment and you are unlikely to be protected if something goes wrong. Take 2 minutes to learn more

Wall Street Memes Price Prediction – May 12
As the day has been passing by, most active responses in the technical outlook of business operations that paired the valuation of the Wall Street Memes coin with the purchasing weight of the American currency have been featured in positives, as the crypto-economic trades boost up in their energy-regaining efforts, making moves to the upside of the indicators.
The price of the WSM coin compared to the U.S. dollar has been rising quickly, with most of its movement staying close to the upper edge of its usual trading range. This usually means there’s growing excitement or confidence in the coin, though it could also hint that it’s becoming overpriced in the short term.
WSM/USD Market
Key Levels
Resistance levels: $0.001, $0.0015, $0.002
Support levels: $0.0005, $0.0004, $0.0003
WSM/USD – 4-hour Chart
The WSM/USD market 4-hour chart reveals that the crypto-economic trades boost up in their energy-regaining efforts, making moves to the upside of the indicators.
At the time of this analysis, the trading chart indicates that the stochastic oscillators are trending downward and remain deeply entrenched in the oversold territory, though they are beginning to show signs of a potential bullish reversal. Meanwhile, the candlestick formation is consolidating near the lower Bollinger Band, reinforcing the likelihood of an imminent upward price movement within the bounds of the indicator’s trend lines.
Given the oversold oscillator conditions, are WSM/USD bears likely to consolidate near the lower Bollinger Band?
Having the WSM/USD market bears tending to consolidate around the lower Bollinger Band will be another opportunity cycle for the crypto-economic trades to boost up in their energy-regaining efforts, making moves to the upside of the indicators.
In the current technical setup, sellers should exercise increased caution, particularly when approaching critical trade zones near the lower trend line of the Bollinger Bands. The WSM/USD pair has exhibited signs of downward exhaustion, with momentum indicators such as the stochastic oscillator firmly positioned in oversold territory. This positioning heightens the risk of a short-term reversal, as any emergence of a bullish candlestick pattern or positive divergence could trigger sharp rebounds—potentially fueled by short-covering and renewed speculative buying interest. Traders are advised to monitor volume activity and intraday price behavior closely, as these factors may provide early confirmation of a directional shift.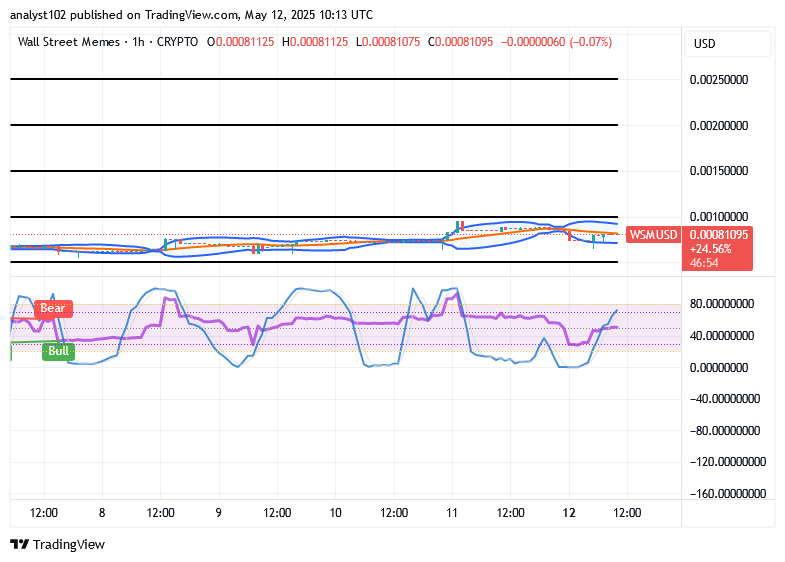
WSM/USD 1-hour chart
The 1-hour chart mirrors that the WSM/USD trades boost up in their energy-regaining efforts, making moves to the upside of the indicators.
On the hourly chart, the Bollinger Bands are tentatively sloping upward toward the $0.001 mark, suggesting a gradual shift in market sentiment. The stochastic oscillators are exhibiting a consistent northbound movement across multiple price zones, marked by cyclical fluctuations that reflect intermittent yet persistent buying activity. This pattern indicates that buyers are steadily gaining ground, even within range-bound conditions, potentially setting the stage for a breakout if momentum continues to build.
Stake Now for Probable Rewards ➡️ https://wallstmemes.com/en/dashboard
Buy Now Before Momentum Builds ➡️ https://wallstmemes.com
🔥 Up To 43% APY Now Available 🔥
— Wall Street Memes (@wallstmemes) October 8, 2023
(at the time of posting)
Stake Now ➡️ https://t.co/X031FQo0bW Buy Now ➡️ https://t.co/6zkwWf1VRF pic.twitter.com/o9qrY1zJn8