Bitcoin (BTC/USD) Performing Conservatively Below $60,000 Level
Estimated Reading Time: 3 minutes
Don’t invest unless you’re prepared to lose all the money you invest. This is a high-risk investment and you are unlikely to be protected if something goes wrong. Take 2 minutes to learn more
Since August 27, the Bitcoin market has been trading below the $60,000 price level with sluggish momentum. It appears that demand and supply may be balancing out, resulting in a potential stalemate at this level as trading activity seems to be entering a period of slowdown. However, despite the current lackluster momentum, the bullish trend is still pointing toward a move back up to the $60,000 price level.
Bitcoin Market Data
- BTC/USD Price Now: $59,260
- BTC/USD Market Cap: $1.2 billion
- BTC/USD Circulating Supply: 20 million
- BTC/USD Total Supply: 20 million
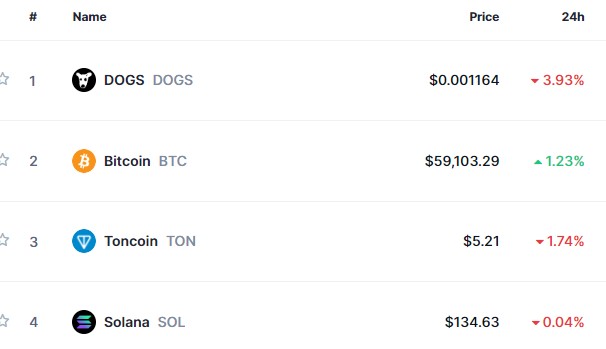
- BTC/USD CoinMarketCap Ranking: #1

Key Levels
- Resistance: $60,000, $65,000, and $70,000
- Support: $56,000, $54,000, and $52,000.
The Bitcoin Market Through the Lens of Indicators
There is a resistance level at the $60,000 mark, but given the current volatility in the Bitcoin market, this resistance could be easily broken. A closer analysis shows that price action has been fluctuating around this level, indicating that a breakout above $60,000 is possible. This scenario is plausible due to the ongoing market volatility.
Taking a broader perspective, there have been signs of building bearish momentum, as illustrated by descending peaks. However, contrary to expectations of a breakdown at the key support level of $56,000, this level has held firm against bearish pressure. Additionally, a higher support level has now emerged at $57,000. This crypto signal suggests that the market still has some bullish prospects.
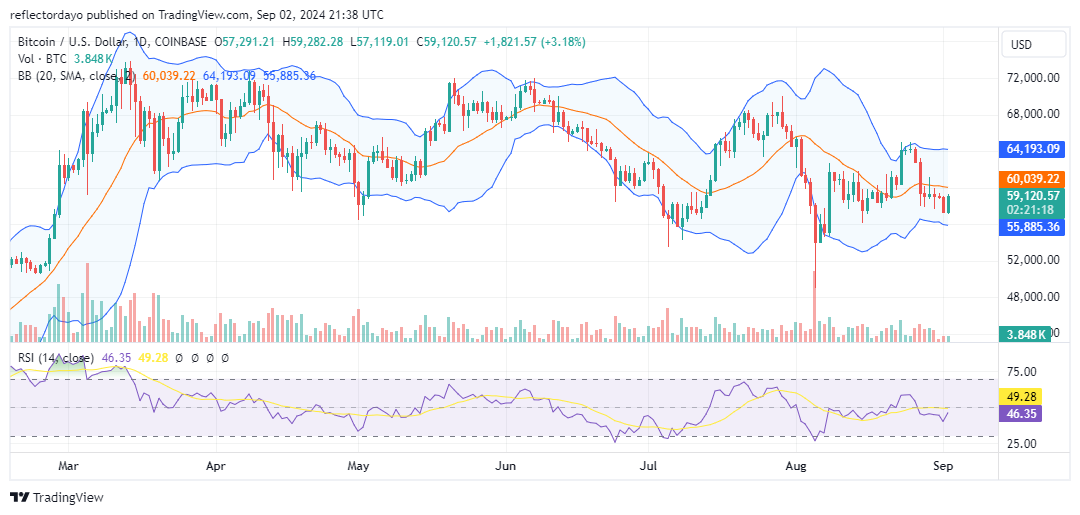
BTC/USD Price Prediction: 4-Hour Chart Analysis
The Bollinger Bands indicator has started to form a horizontally moving price channel. While the descending peaks are also clearly depicted on the 4-hour chart, the key support level at $56,000 remains firm. Despite the low trading volume observed from the 4-hour chart, it is unlikely that the ongoing bearish momentum will break through this support threshold. Although the price is currently experiencing an upswing, the relatively low trading volume suggests that bearish resistance at the $60,000 level could be strong. This is evident from the upper shadow on the latest candlestick.