Ronin (RON/USD) May Be Ending the Bearish Trend As It Forms a Pivot at $1.40
Estimated Reading Time: 2 minutes
Don’t invest unless you’re prepared to lose all the money you invest. This is a high-risk investment and you are unlikely to be protected if something goes wrong. Take 2 minutes to learn more
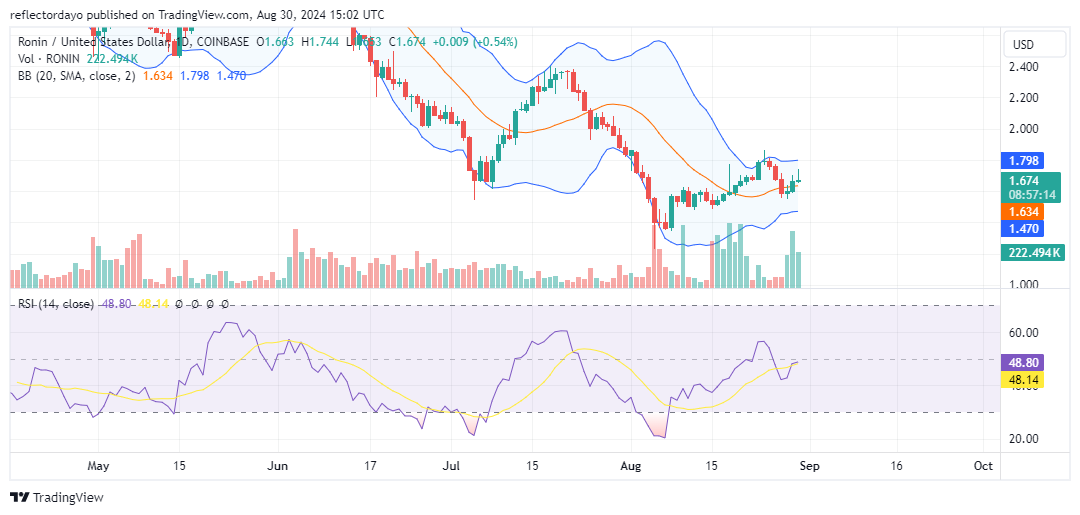
Based on the chart, the Ronin market was first featured at around the $3.66 price level in March. After reaching a peak above the $4.40 level by March 26, the market started a downward trend. The price action has been characterized by lower lows and lower highs. This decline in the cryptocurrency’s signal may have encouraged traders to continue selling, as the price continues to trend downwards.
Ronin Market Data
- RON/USD Price Now: $1.694
- RON/USD Market Cap: $583 million
- RON/USD Circulating Supply: 346 million
- RON/USD Total Supply: 1 billion
- RON/USD CoinMarketCap Ranking: #92
Key Levels
- Resistance: $1.800, $1.900, and $2.000
- Support: $1.500, $0.450, and $0.450.
The Ronin Market Through the Lens of Indicators
The Ronin market’s potential for a further rebound became more feasible when it broke above the nearest resistance level at $1.60. This level is now acting as support, with bullish momentum facing rejection at $1.80. Given the market’s previous bearish movements, traders might be exercising caution. However, converting the $1.60 level into support is a positive sign for the bulls. If the price action continues to move upwards, it could break above the $1.80 level and aim for higher price targets. Nonetheless, with today’s trading activity forming a shooting star pattern near the $1.80 level, the strength of the bears remains evident.
RON/USD Price Prediction: 4-Hour Chart Analysis
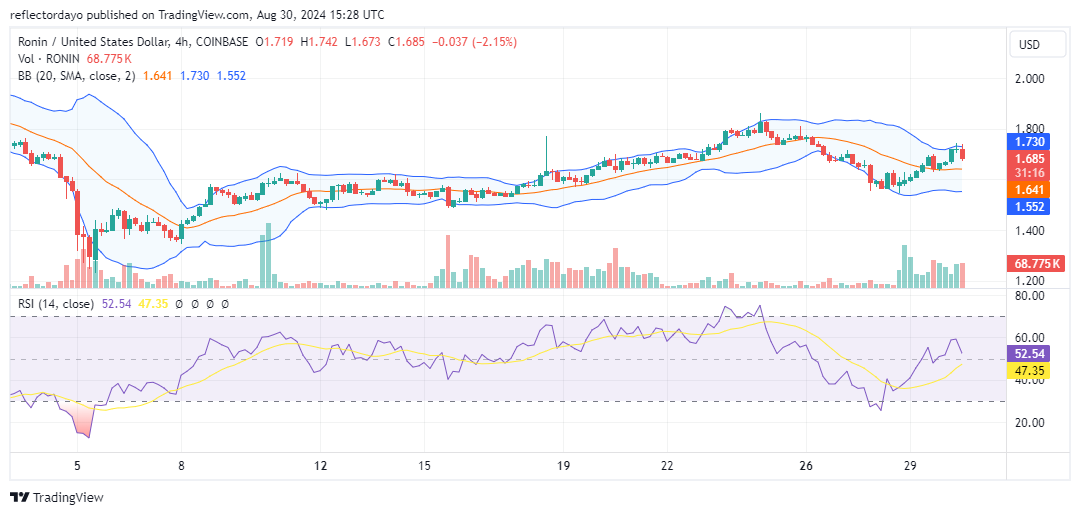
On a shorter time frame, the market appears to be consolidating after encountering significant bearish sentiment at the $1.80 price level. Despite this, the trading volume has shown substantial histograms, leading to increased volatility and a wavy price action pattern. Nevertheless, the market has maintained its position at a higher level, forming a higher high. This is encouraging for traders anticipating a continuation of the bullish recovery. It is crucial for traders to monitor the $1.80 price level, as a breakout above this level will be important for sustaining bullish sentiment.