Axelar (AXL/USD) Aims to Revert Downward Trend
Estimated Reading Time: 3 minutes
Don’t invest unless you’re prepared to lose all the money you invest. This is a high-risk investment and you are unlikely to be protected if something goes wrong. Take 2 minutes to learn more
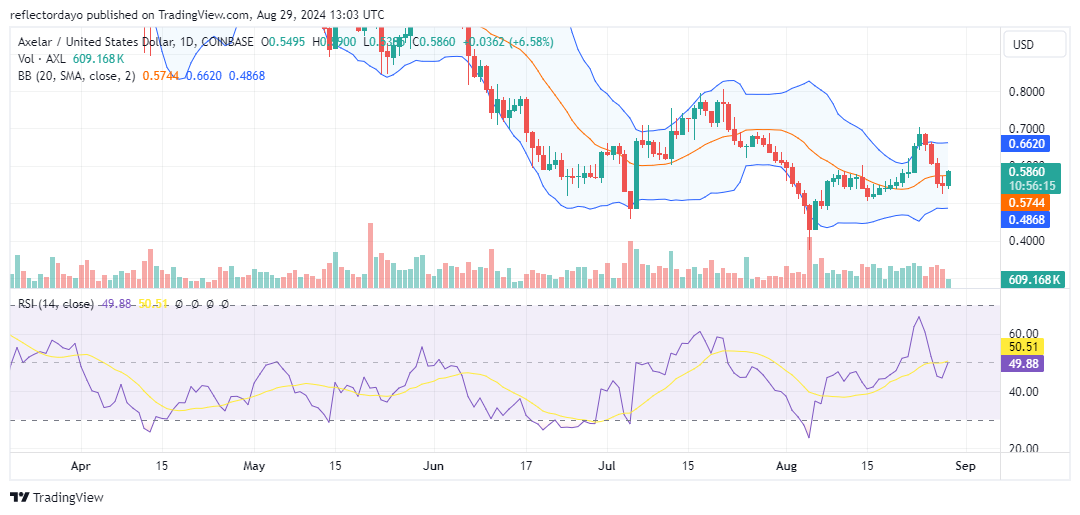
A bird’s-eye view of the Axelar market reveals that it had been in a downtrend previously. However, in early August, after the market found a pivotal support level, the price action reversed, indicating an upward trajectory. Signaling the potential seriousness of this bullish reversal, the market broke through the first key resistance level at $0.578 and even reached as high as $0.700 before the bullish momentum began to wane. This loss of momentum allowed the bears to regain control, causing the market to pull back. Despite this downturn, the price has not fallen to levels that would diminish optimism for a continued bullish recovery.
Axelar Market Data
- AXL/USD Price Now: $0.5842
- AXL/USD Market Cap: $444 million
- AXL/USD Circulating Supply: 785 million
- AXL/USD Total Supply: 1.2 billion
- AXL/USD CoinMarketCap Ranking: #121
Key Levels
- Resistance: $0.600, $0.650, and $0.700
- Support: $0.550, $0.500, and $0.450.
The Axelar Market Through the Lens of Indicators
After the Axelar market faced significant rejection at the $0.700 price threshold, it fell back to the $0.578 level, which had previously served as resistance but is now acting as a support level. This price level is a crucial milestone in the bullish recovery. The next target is the $0.700 level, and the price action is currently rallying back toward this mark. While the bullish recovery looks promising at the moment, there may be some resistance around the $0.600 level. If this occurs, and bullish sentiment match up with bearish sentiment resulting in a consolidation phase, a new higher support level could emerge at that point. Should this support level hold, the bulls will be well-positioned to challenge the $0.700 price level again.
The candlestick representing today’s trading is notable, although the trade volume histogram indicates relatively low activity. This crypto signal suggests that breaking through the $0.600 resistance level might be challenging given the low trading volume in the current bullish market.
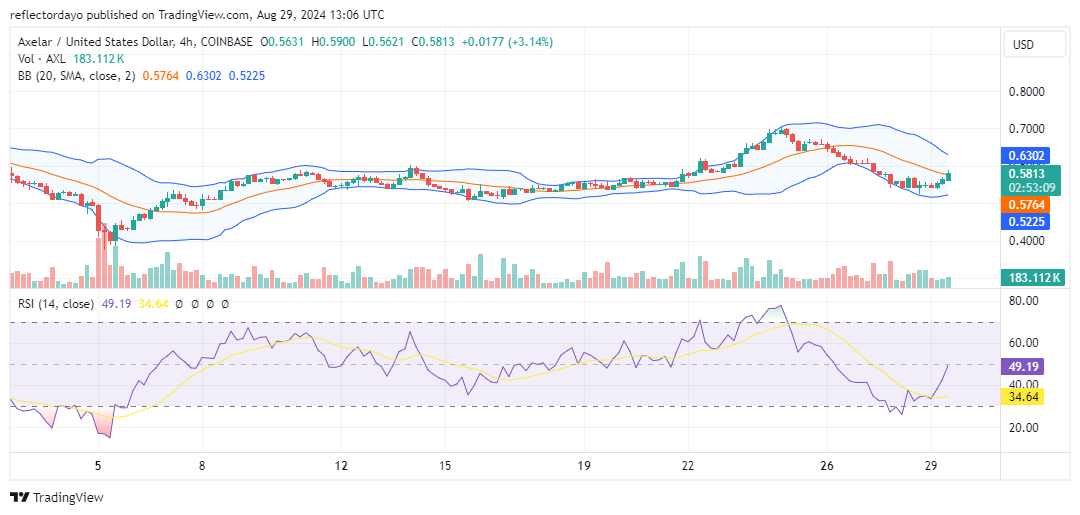
AXL/USD Price Prediction: 4-Hour Chart Analysis
From the perspective of the 4-hour chart, the Bollinger Bands indicate that the price channel initially began to turn downward. However, after the market found support at the $0.54 level and started to move upward, the lower standard deviation began converging towards the upper standard deviation. Currently, the price action has caught up with the 20-day moving average. According to the Relative Strength Index (RSI), the RSI line is now at the midpoint of the indicator, suggesting that the current price is at an equilibrium level. If the price remains at this level, the market may consolidate before determining its next direction.


