Wall Street Memes (WSM/USD) Price Jolts About, Building Spirals
Estimated Reading Time: 4 minutes
Don’t invest unless you’re prepared to lose all the money you invest. This is a high-risk investment and you are unlikely to be protected if something goes wrong. Take 2 minutes to learn more

Wall Street Memes Price Prediction – May 10
More positivism is being steadily demonstrated in the capacity modes that buying forces have been raising against the stances of sellers as regards the business operations that paired the trade lines of the Wall Street Memes coin with the valuation of the American currency, given that the price jolts about, building momentum.
Long-term position takers should view the $0.001 to $0.0005 range as a prime accumulation zone within a broader bullish trend structure. Repeated market behavior confirms this range as high-probability support for re-accumulation, where dips continue to attract strong demand. Momentum indicators support this upward bias, validating long-entry strategies on pullbacks. Despite near-term consolidation, the technical setup favors accumulation over breakdown, reinforcing confidence in the long-term upside.
WSM/USD Market
Key Levels
Resistance levels: $0.001, $0.0015, $0.002
Support levels: $0.0005, $0.0004, $0.0003
WSM/USD – 4-hour Chart
The WSM/USD 4-hour chart showcases that the crypto-economic market price jolts about, building momentum.
Bollinger Bands continue to exhibit pronounced lateral constriction, indicating sustained volatility compression within the $0.0005–$0.001 consolidation corridor. Concurrently, stochastic oscillators maintain a bullish trajectory, gradually approaching the overbought threshold near the 80 level—reinforcing momentum alignment with potential upside expansion.
Is WSM/USD priming for a rebound as it holds within the promising $0.001–$0.0005 zone?
It has been on a daily basis that the WSM/USD market participants are optimistically garnering more positional orders ahead of unprecedented potential rebounds as the activities are being held within the values of $0.001 and $0.0005, given that the price jolts about, building momentum.
Long-term capitalists should recognize that the WSM/USD market appears to be entering the late stages of downside exhaustion—an ideal precursor to major uptrend cycles. With bearish momentum fading and accumulation sentiment strengthening, this phase offers a strategic window for early positioning ahead of potential sharp rebounds. Patience during this consolidation could be well rewarded as bullish catalysts continue to surface.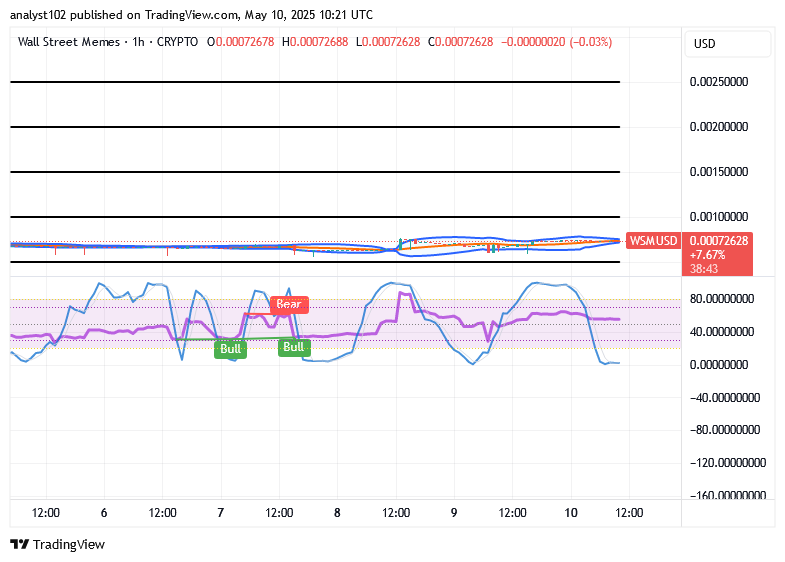
WSM/USD 1-hour chart
The 1-hour chart demonstrates that the WSM/USD market price jolts about, building momentum.
The current technical configuration reflects a cohesive alignment across both medium- and short-term timeframes, reinforcing the validity of bullish signal confluence in the WSM/USD market. Notably, stochastic oscillators have entered deeply oversold territory, signaling a declining probability for further sell-side continuation. Simultaneously, Bollinger Bands reveal expanding volatility with a bias toward upward pressure, as increased participant activity suggests a broadening re-entry interest during this accumulation-driven phase.
🚀 BIGTIMEUSDT & WSMUSDT perpetual futures are now live on Bybit’s derivatives exchange!
Trade these USDT-margined contracts with high leverage, deep liquidity, and low funding rates.
Ready to enter the market? 🔥📈
🚀 BIGTIMEUSDT & WSMUSDT Contracts now on Bybit!
— Bybit (@Bybit_Official) October 12, 2023
Dive into new trading opportunities with 1-25x leverage. Plus, they’re now on Bybit Futures Grid Bot! Start trading now.
📈 BIGTIME: https://t.co/FAQlbhnzAh
📈 WSM: https://t.co/pb2y2AfMBE#CryptoTrading #Bybit