$SPONGE (SPONGE/USD) Bullish Signs Emerge: Time to Dive In?
Estimated Reading Time: 3 minutes
Don’t invest unless you’re prepared to lose all the money you invest. This is a high-risk investment and you are unlikely to be protected if something goes wrong. Take 2 minutes to learn more

In our recent analysis of SPONGE/USD prices, we observed a notable level of stability in the market, particularly evident around the $0.00005 price point, specifically at $0.000048. Despite sideways movement persisting around the $0.000050 price threshold, there has been a slight bullish inclination observed. This shift is particularly noteworthy as it reflects a transition from the range between $0.000045 and $0.000050. Although relatively minor, this movement holds significant implications, indicating a pronounced willingness among traders to engage at this level.
Key Market Dynamics:
- Resistance Levels: $0.0010, $0.0011, and $0.0012.
- Support Levels: $0.000035, $0.000030, and $0.000025.
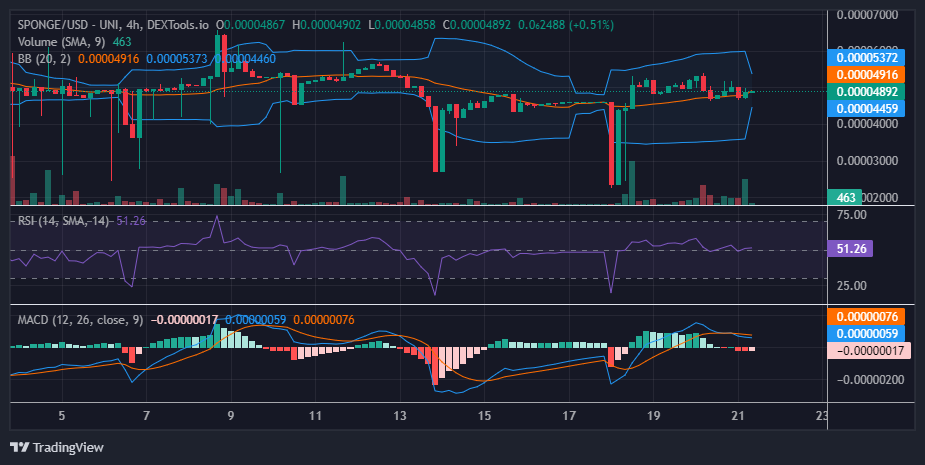
Delving into Technical Analysis for $SPONGE (SPONGE/USD):
Upon analysis of the 4-hour chart, we have observed a market exhibiting a sideways trend within the Bollinger Band indicator, characterized by a notable bandwidth. Despite this sideways movement, volatility around the $0.00005 price level appears substantial. However, a notable development is the sharp contraction of the band, suggesting a significant decrease in volatility. This crypto signal hints at an imminent breakout in SPONGE/USD market prices, with indications leaning towards a potential upward movement. This expectation is reinforced by the observation of a higher low secured at the $0.000047 price level within the bullish trend, following the previous low at $0.000023. Moreover, considering the consistent and swift price recoveries below the $0.00005 price level, there appears to be a strong bullish sentiment prevailing in this range.
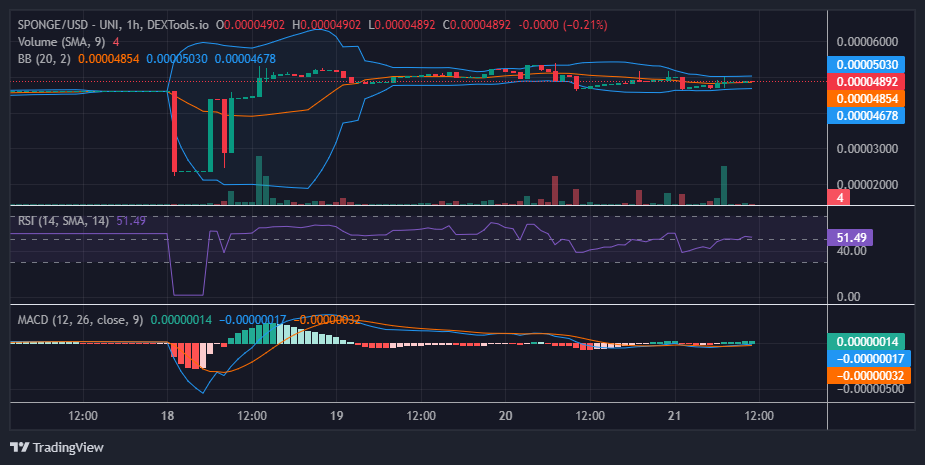
Insights from the 1-Hour Perspective:
On a shorter timeframe, we’ve observed the price action consolidating within a narrow price channel, predominantly hovering around the $0.000048 level, accompanied by Bollinger Bands indicating a minimal bandwidth. Examination through the lens of the Relative Strength Index reveals the market is positioned at its midpoint. Presently, the market appears to be in anticipation of a catalyst, with indications suggesting a potential continuation of its bullish trajectory in the forthcoming price movements.
Buy SPONGE/USD and absorb more damp!
NEVER ENOUGH 💦🧽$SPONGE #Web3 #Crypto #Altcoins pic.twitter.com/YU8DsL96fu
— $SPONGE (@spongeoneth) April 21, 2024
Invest in the hottest and best meme coin. Buy Sponge ($SPONGE) today!