Quant Price Prediction: QNT/USD Consolidates Near $100; Price Will Climb Higher
Estimated Reading Time: 3 minutes
Don’t invest unless you’re prepared to lose all the money you invest. This is a high-risk investment and you are unlikely to be protected if something goes wrong. Take 2 minutes to learn more
Quant (QNT) Price Prediction – May 26
After touching the daily high of $99.86, the Quant price begins a downside correction which will move toward the resistance level of $100.
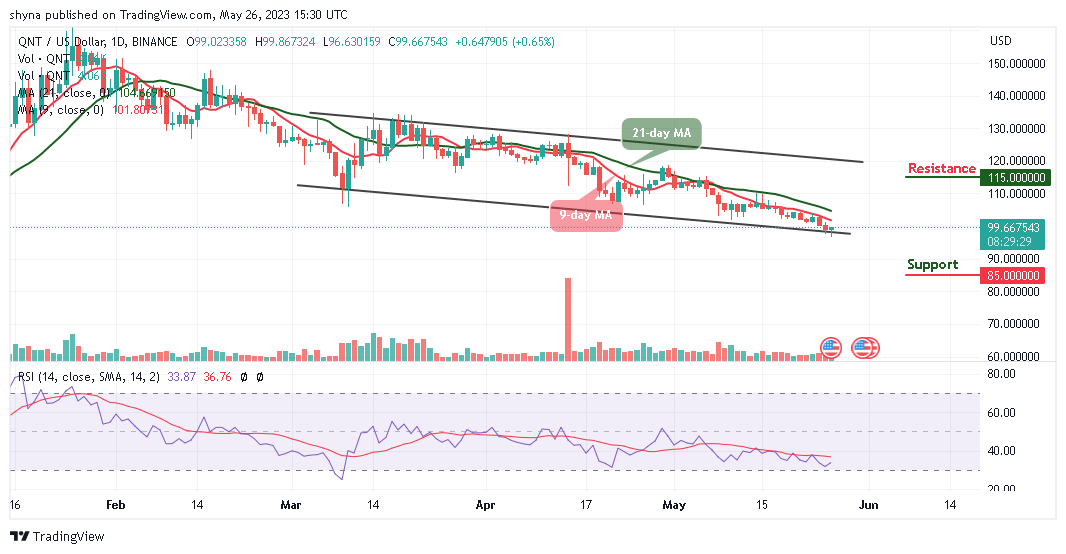
QNT/USD Long-term Trend: Bearish (Daily Chart)
Key levels:
Resistance Levels: $115, $120, $125
Support Levels: $85, $80, $75
Today, QNT/USD is trading around the $99.6 level as buying pressure resumes. The market price even touches $96.6 before stabilizing. At the time of writing, QNT/USD is still trading below the 9-day and 21-day moving averages as it gains 0.65% at its price of $99.6.
Quant Price Prediction: What to Expect from Quant (QNT)
The Quant price is likely to test the lower level if crosses below the lower boundary of the channel. A decisive breakout below $95 support may intensify selling pressure. Therefore, if bears bring the market price to the negative side, the consolidation may turn into a bear run. On the other hand, the sideways movement could also play out for the coin, and the next hurdle for the king coin could emerge at $100, but that won’t stop the higher price movements.
However, bulls need massive liquidity and volume to cross the $112 level and make a dash to the $114 level. The technical indicator Relative Strength Index (14) is seen moving below the 35-level as any sharp downward slope could be an indication of the influence which may allow bears to increase the pressure.
Meanwhile, a reversal is possible but only if the price touches the support level of $98.00. The persistent trade above the moving averages may technically push the coin to the resistance levels of $115, $120, and $125 while the supports lie at $85, $80, and $75.
QNT/USD Medium-Term Trend: Bearish (4H Chart)
Looking at the 4-Hour chart, Quant (QNT) rises above the 9-day moving average to touch the daily high of $99.86. With this, the Quant price could hover above the 21-day moving average and may likely take time to trade above the current market value at $99.75.
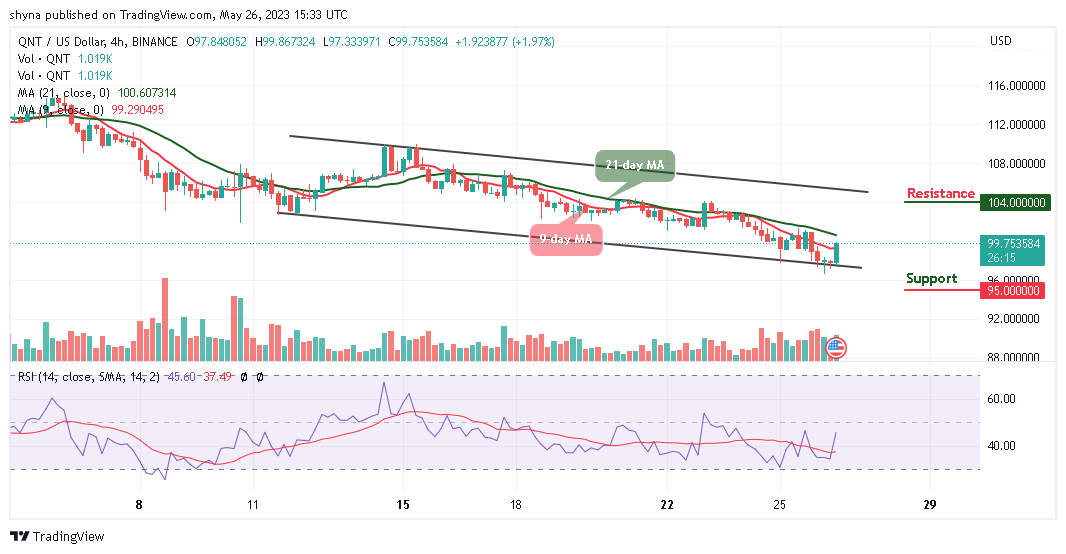
However, if the bulls increase the buying pressure, the price may likely hit the resistance level of $104 and above. In other words, if the bears should bring the price below the lower boundary of the channel, the support level of $95 and below could be visited. The Relative Strength Index (14) is moving to cross above the 50-level, suggesting that bullish signals may come into play.
Place winning Quant trades with us. Get QNT here

