Tamadoge (TAMA/USD) Gradually Climbing: A Look at Recent Price Action
Estimated Reading Time: 3 minutes
Don’t invest unless you’re prepared to lose all the money you invest. This is a high-risk investment and you are unlikely to be protected if something goes wrong. Take 2 minutes to learn more
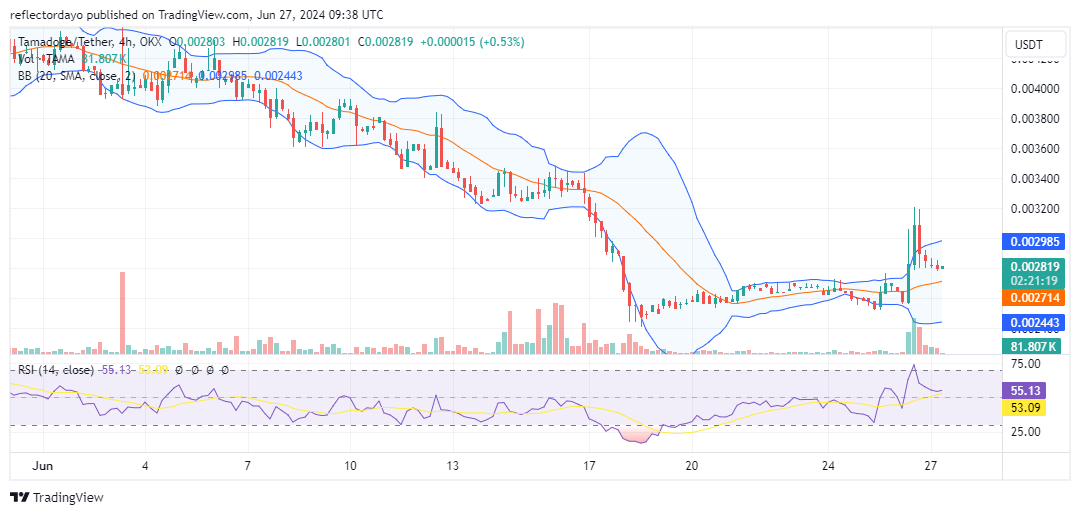
Last week, Tamadoge experienced a significant selloff, causing the price to drop sharply until bullish intervention occurred at the $0.0024 level. Subsequently, the price action began a gradual recovery, possibly due to lingering bearish sentiment in the market. This trend continued until Wednesday, June 26, when the bulls gained strength and drove the price up dramatically. However, this rapid price movement led to a quick market exhaustion at the $0.0032 level as traders began to take profits.
Key Levels
- Resistance: $0.013, $0.014, and $0.015.
- Support: $0.0035, $0.0030, and $0.0025.
TAMA/USD Price Analysis: The Indicators’ Point of View
As profit-taking activities continue in the Tamadoge market, a sharp price decline has been noted. This is typical, as a strong bullish trend is often followed by a corresponding bearish trend. The bull run has increased market volatility, and bears may be taking advantage of this. However, bulls have found support at the $0.0028 level, and the price action is currently ranging sideways at this level. We can expect the market to retrace to the $0.0032 level, as higher lows are observable. The Bollinger Bands indicator also depicts an upward trending market. It is likely that the price will continue to range sideways around the $0.0028 level for a while, before resuming its upward movement.
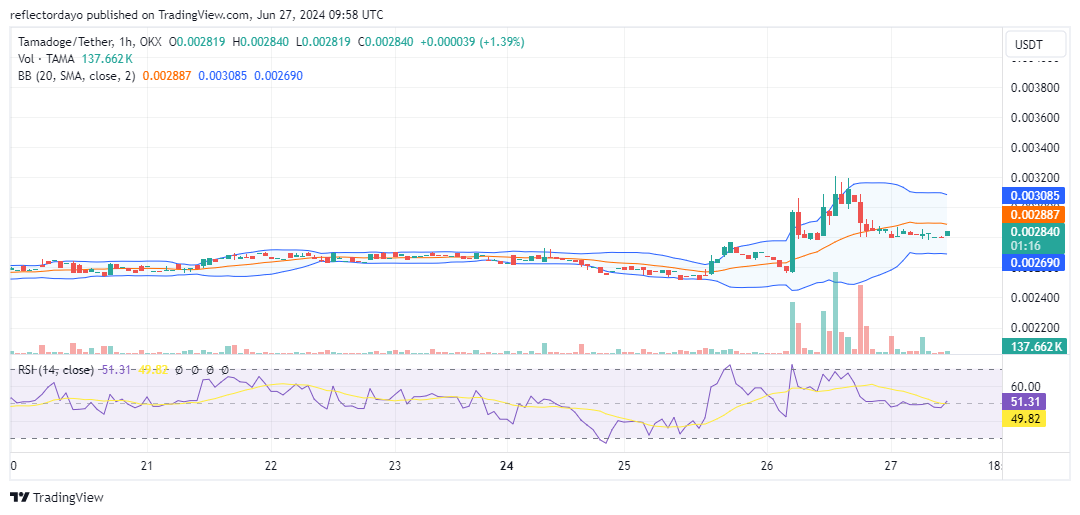
Tamadoge Short-Term Outlook: 1-Hour Chart
The 1-hour chart shows an observable ascending consolidation pattern, identifying key price levels of interest to investors, including $0.002523, $0.0026, and $0.0028. This ongoing market dynamic could eventually result in a price breakout. Despite the continuous appearance of consolidation at higher levels, which signifies investor indecision, the Bollinger Bands still indicate a high level of volatility. Investors should pay attention to the trade volume indicator, as increasing histogram heights may influence the direction of price action. The market appears poised for bullish movement.
PlayToEarn offers an excellent opportunity to reward committed Crypto gamers!
#PlayToEarn is a great way to reward dedicated #Crypto gamers! 👾 🎮
All players earn $TAMA – the higher you score, the more you win. 🚀
Beat the rest:👇
📱 Android: https://t.co/D4TjX7gTFl
📱 iOS: https://t.co/0fjJapf5oA#Tamadoge #Cryptocurrency #DogeOrNothing pic.twitter.com/1fZJNEVhQ2— TAMADOGE (@Tamadogecoin) June 26, 2024
Do you want a coin that will be 100 times more valuable in the next few months? That is Tamadoge. Buy TAMA today!