XRP Holds Flat above the $0.54 as It Retests the Previous Peak
Estimated Reading Time: 2 minutes
Don’t invest unless you’re prepared to lose all the money you invest. This is a high-risk investment and you are unlikely to be protected if something goes wrong. Take 2 minutes to learn more
XRP (XRP) Long-Term Analysis: Bullish
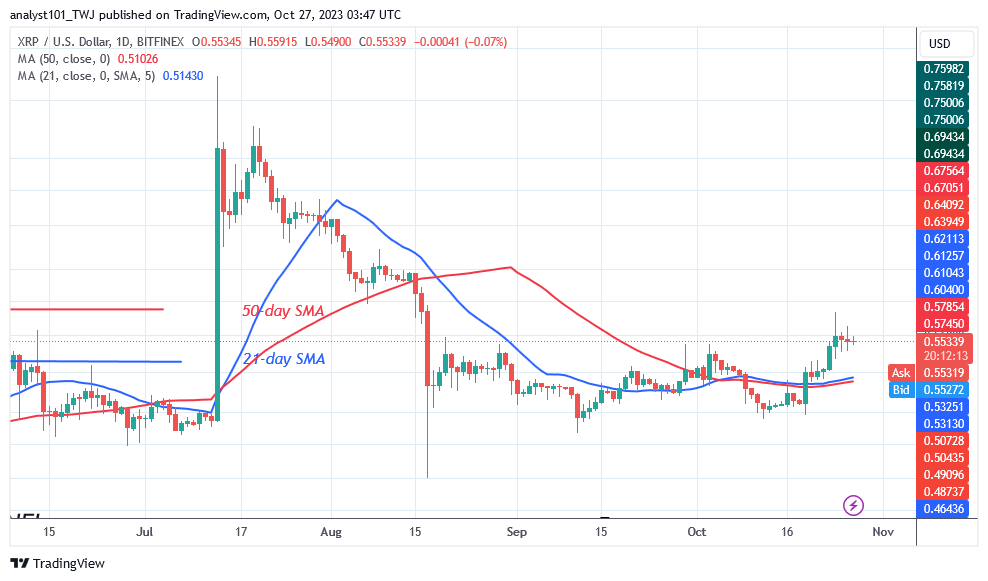
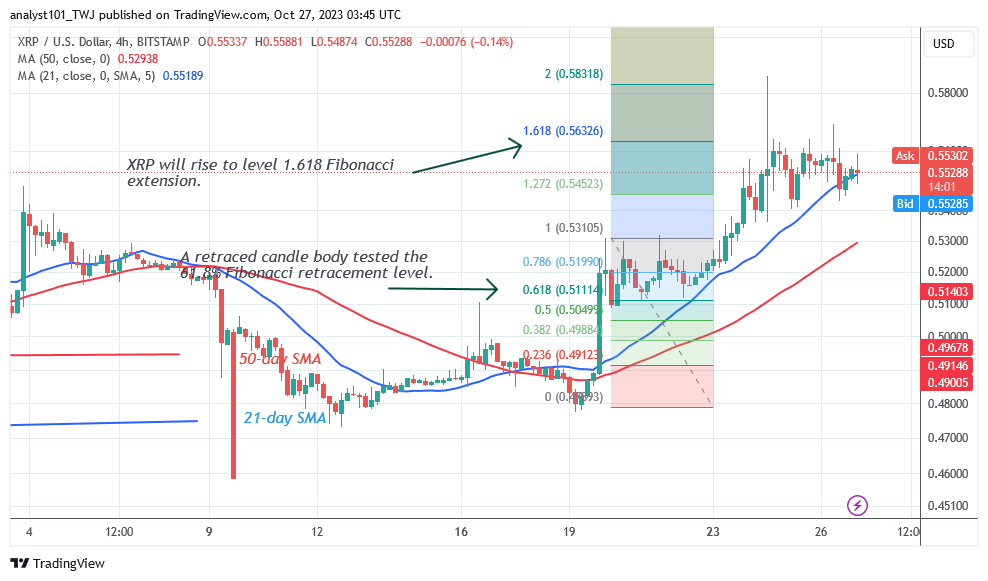
The price of XRP (XRP) has risen, breaking above the moving average lines as it retests the previous peak. The bullish trend has ended after reaching a high of $0.58. The altcoin has now retraced to a low of $0.54. The cryptocurrency fell out of its range-bound zone of $0.45 to $0.55. Since the price drop on August 17, XRP has remained in its current range, continuing its sideways pattern.
XRPP/USD has not seen considerable price fluctuation in the last two months. The resistance at $0.55 has continued to restrict the upward movement. For example, the bullish momentum was stopped four times by significant selling pressure at the higher price level.
Technical Indicators:
Major Resistance Levels – $1.00, $1.50, $2.00
Major Support Levels – $0.50, $0.30, $0.10
XRP (XRP) Indicator Analysis
Before the breakout, the cryptocurrency’s price was below the moving average lines. As long as the altcoin continues above the moving average lines, it will continue to increase and retest the resistance level. In the lower time frame, the price bars fall within the moving average lines indicating that the altcoin will continue its sideways movement.
What Is the Next Direction for XRP (XRP)?
The recent price recovery was short-lived as it retests the previous peak. XRP/USD will continue to bounce between price levels in the range-bound zone. This time, the price variation is below the resistance level, indicating a possible breakout. At the moment, the price has held flat above the $0.54 support.
You can purchase crypto coins here. Buy LBLOCK
Note: Cryptosignals.org is not a financial advisor. Do your research before investing your funds in any financial asset or presented product or event. We are not responsible for your investing results