Polkadot (DOT/USDT) Struggles Near Support: Potential Break or Rebound?
Estimated Reading Time: 3 minutes
Don’t invest unless you’re prepared to lose all the money you invest. This is a high-risk investment and you are unlikely to be protected if something goes wrong. Take 2 minutes to learn more
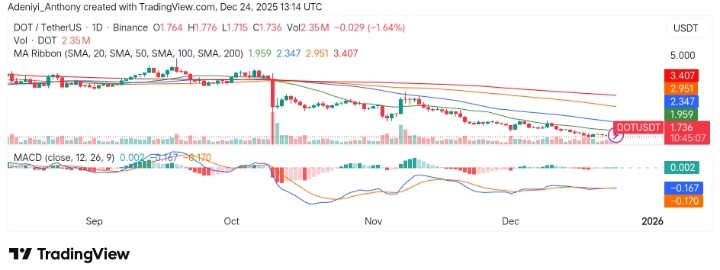
Polkadot against Tether in the last 24 hours has dropped by 2.2% to $1.72, underperforming the broader crypto market decline of 0.86%. As it stands, this decline is part of a larger downtrend, as the coin records 7.8% on the weekly chart and 25% over the month. From a technical point of view, one key factor behind this drop is a failure to maintain the critical support level of $1.76, which has triggered an even more bearish trend.
From another angle, Polkadot’s underperformance can be linked to the overall market’s risk aversion due to Bitcoin’s dominance rising to 59.1%. To this end, it is apparent that weak interest from investors affects the pair as trading volume lowers by 9%, suggesting reduced buying momentum.
Currently, Polkadot trades at $1.736, recording more than 2.35 million in volume on the daily chart.
Technical Indicators
Major Resistance Levels: $1.959, $2.347, and $2.951
Major Support Levels: $1.715, $1.690, and $1.500
Technical Analysis
Technically, Polkadot against Tether on the daily timeframe appears to be testing the support at $1.715, trending downward as the price continues to act under the cluster of the simple moving averages. Additionally, the moving averages on the chart show the bears are still dominating, as the MACD shows no sign of an impending directional break.
As it stands, if the bulls fail to increase participation, a move towards $1.500 may be noticeable in the near term.
$DOT is compressing inside a descending triangle on the daily chart.
Price is sitting right on key horizontal support (~1.75) — pressure is building.🔻 Lose support → continuation to the downside
🔺 Hold & reclaim trendline → relief bounce possibleVolatility is coming.… pic.twitter.com/APHtEneyI2
— Erick Crypto ₿ (@ErickCrypto21M) December 23, 2025
Meanwhile, @EricCrypto21M has discussed Polkadot’s current price action, stating that the token is forming a descending triangle on the daily chart. The analyst is of the opinion that the price is sitting at a crucial horizontal support level around 1.75, indicating that pressure is building. It was suggested that if DOT loses this support, a further downside move would erupt, but a bounce would surface if the token reclaims the trendline.
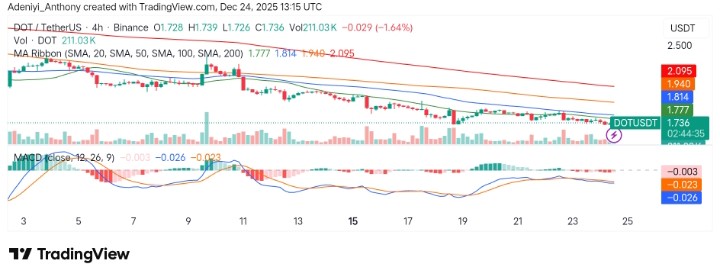
DOT/USDT Analysis: Is a Break above $1.77 Possible?
DOT/USDT on the 4-hour chart appears to be encountering resistance near the $1.777 level, with a downward slant forming. Additionally, the MACD seems to be showing negative bars depicting increasing bearish pressure even as the price operation remains limited under the moving averages.
To this end, if the $1.77 remains intact, a move to the south in the short term may be inevitable for another leg up.
You can purchase crypto coins here. Buy Crypto
