Bitcoin (BTC/USD) Trade Is Rising, Attempts Breaking Resistances
Estimated Reading Time: 3 minutes
Don’t invest unless you’re prepared to lose all the money you invest. This is a high-risk investment and you are unlikely to be protected if something goes wrong. Take 2 minutes to learn more
Bitcoin Price Prediction – December 21
The price actions that mark the presence of rises and decreases in the valuation of Bitcoin versus the worth of the US Dollar as the crypto-economic trade now sets for recovery after making a base, breaking resistances toward the point of $40,000.
The buying pressure has been building toward the $45,000 mark over time, not allowing any downside impulses. The trade activities will result in a pit stop or a reversal move once bulls apply force to test the point. Conversely, bears may eventually reclaim a respectable selling entry with the help of stochastic oscillators that are positioned in the overbought area.
BTC/USD Market
Key Levels:
Resistance levels: $45,000, $47,500, $50,000
Support levels: $40,000, $37,500, $35,000
BTC/USD – Daily Chart
The BTC/USD daily chart reveals the crypto market is recovering from a lower trading spot and attempts to break resistances toward $45,000.
The trend lines of the Bollinger Band are oriented northward, from $40,000 to $45,000. Finding trustworthy repurchase orders around the middle Bollinger Band’s trend line has been the recovery strategy for the majority of market corrections. The blue line on the stochastic oscillators has been bent northward from the oversold area to sit just below 40.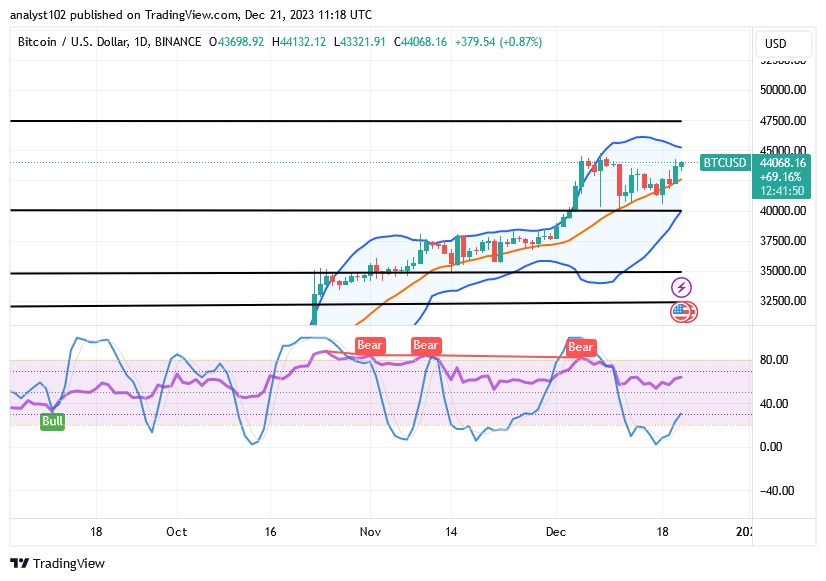
What rising stance does the BTC/USD market currently have as it trades at $44,068.16?
Presently, the increasing force attitude tends to prolong as the mid-point of $42,500 remains unbroken and the BTC/USD trade is recovering, attempting to break resistances to average the line of $45,000.
It’s possible that long-position placers are prone to pushing higher yet by stepping up their efforts to continue running above $45,000. Long-term, the $40,000 mark will continue to be the crucial barrier against any potential declines in the perfect underlying support.
As regards the southward technical analysis of this market at this time, the forces to the upside are ongoing. And sellers are in a top-notch position to resist the moves once it gets exhausted around its higher trade zone of around $47,500. Therefore, it requires some level of patience before that can be achieved.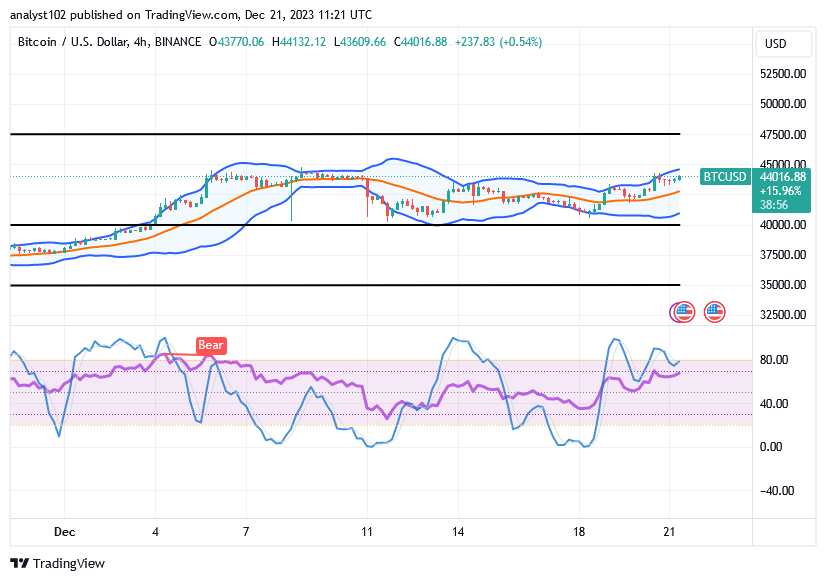
BTC/USD 4-hour Chart
The BTC/USD 4-hour chart depicts that the crypto price is recovering as it attempts to break resistances toward the point of $45,000.
Variant 4-hour candlesticks have consistently appeared in the $45,000–$40,000 price range. Around 80, the stochastic oscillators seem to be veering to the north, occasionally sinking the blue line into the overbought area. Technically speaking, those positions have also been viewed as large range-bound locations, according to the Bollinger Bands’ indications.
Note: Cryptosignals.org is not a financial advisor. Do your research before investing your funds in any financial asset or presented product or event. We are not responsible for your investing results.
You can purchase Lucky Block here. Buy LBLOCK