Bitcoin (BTC/USD) Price Is Consolidating, Pushing Northwardly
Estimated Reading Time: 3 minutes
Don’t invest unless you’re prepared to lose all the money you invest. This is a high-risk investment and you are unlikely to be protected if something goes wrong. Take 2 minutes to learn more

Bitcoin Price Prediction – December 6
As there are senses of overbought trading sessions in the market activities of the BTC and the USD, the crypto economy has been seen consolidating at higher zones, pushing northwardly through some resistances.
The BTC/USD market’s activities have unambiguously been confirmed to have maintained a straight course along the upper edge of the Bollinger Band. It has been shown that buyers are currently going through the motions of avoiding any kind of reversion. Bears may have to wait for new selling cycles, but in the interim, the overhead barrier-trading line of $45,000 has been approached with great precision.
BTC/USD Market
Key Levels:
Resistance levels: $47,500, $50,000, $52,500
Support levels: $40,000, $37,500, $35,000
BTC/USD – Daily Chart
The BTC/USD daily chart showcases that the crypto-economic price is consolidating, pushing northwardly through variant resistances toward the point of $45,000.
The Bollinger Band trend lines have been stretching northwardly alongside the upper area, leaving the middle part to point to the upside underneath it, making supportive modes for it. The stochastic oscillators have traversed into the overbought region, moving in a consolidation manner to assert that buyers are still in charge.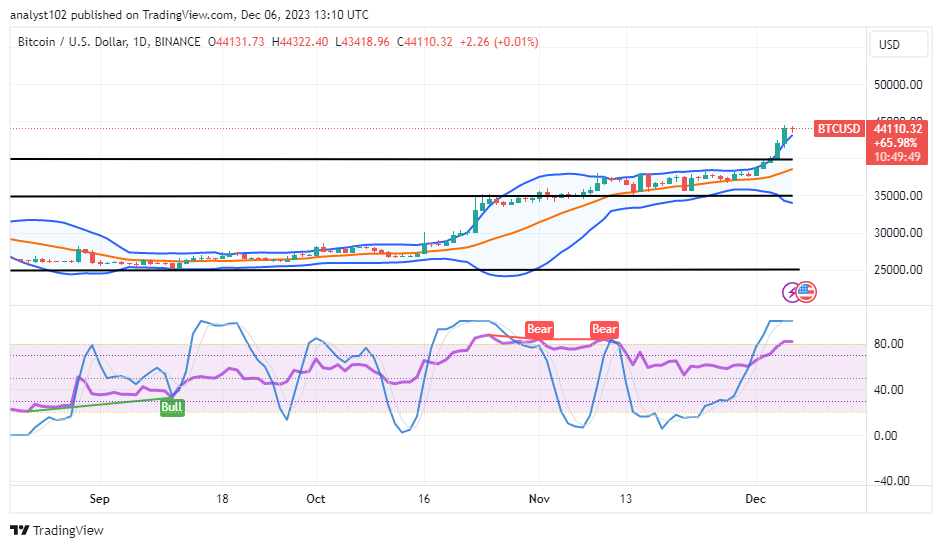
In what circumstances might there be another round of sell-offs in the BTC/USD market?
An abrupt bearish candlestick formation against the uprising force may constitute the conditions that can give rise to a selling situation. The BTC/USD market is consolidating, pushing northward of resistance nearing the value of 445,000.
As things stand, bulls should continue to rise in the ensuing trading sessions by preventing any retracement force from reaching the bullish penultimate trading candlestick that developed along the upper Bollinger Band trend line. This will allow them to maintain the sustainability of the velocity towards the north. It is recommended that investors stick to their buying and holding strategies.
It would take a lot of work to execute quick shorting orders before making good entrances around the higher resistances. In order to protect themselves against any unpredictable situation that would tend to upsurge against the entry, bears may need to project specific zones of overhead barrier trading and place a sell limit order with the notion of a substantial stop loss order.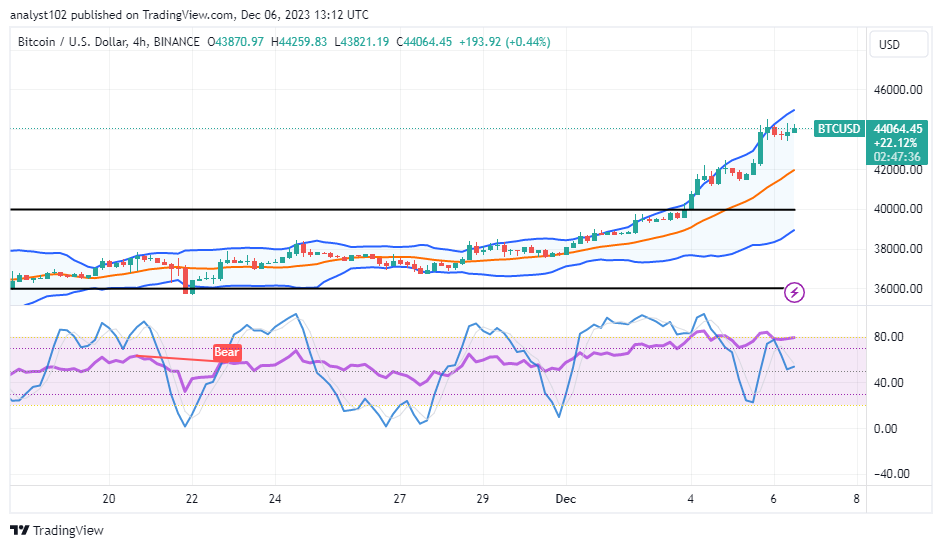
BTC/USD 4-hour Chart
The BTC/USD 4-hour chart showcases that the crypto-economic price is consolidating, pushing northwardly around the upper Bollinger Band.
The Bollinger Band trend lines are managing to place northward to signify that buying pressures are on the rise. The stochastic oscillators are in the mode of swerving northbound to ascertain the moments when the price will be surging reliably. Being as it is, bulls have to be wary of losing their stances fearfully against the value of $42,000 in the near future.
Note: Cryptosignals.org is not a financial advisor. Do your research before investing your funds in any financial asset or presented product or event. We are not responsible for your investing results.
You can purchase Lucky Block here. Buy LBLOCK