POL (Prev. MATIC) Price Prediction: POL/USDT Upward Rebound Extends
Estimated Reading Time: 2 minutes
Don’t invest unless you’re prepared to lose all the money you invest. This is a high-risk investment and you are unlikely to be protected if something goes wrong. Take 2 minutes to learn more

Date: January 10, 2026
The POL (prev. MATIC) market is witnessing a sustained upward price movement. Price action in this market has remained bullish for an extended period, and further upside moves may still emerge.
POL/USDT Long-Term Trend — Bullish (Daily Chart)
Key Price Levels
Resistance: $0.1800, $0.2000, $0.2250
Support: $0.1700, $0.1500, $0.1300
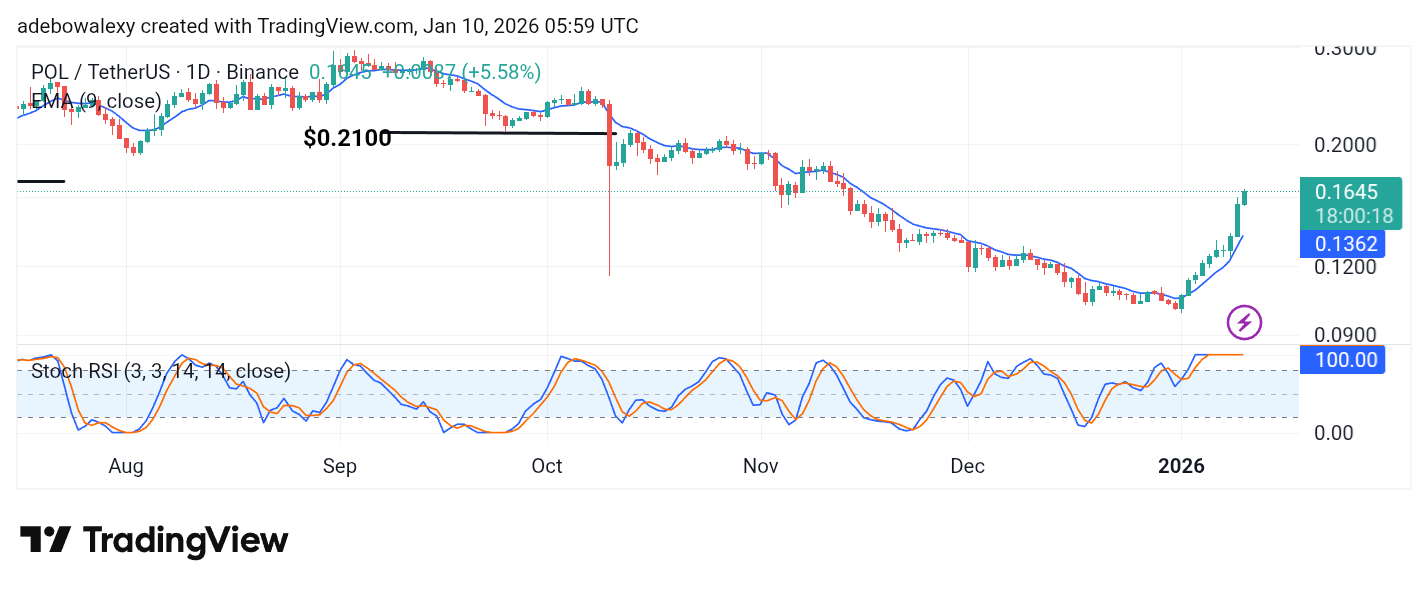
Over the past nine trading sessions, price action in the POL (prev. MATIC) market has remained on a bullish trajectory. The current session has continued this trend, printing a green candle above the 9-day Exponential Moving Average (EMA). During this session, the market has breached the psychological $0.1600 price level.
The Stochastic Relative Strength Index (SRSI) lines are moving sideways near the 100 level, indicating a potential price peak at this stage.
POL/USDT Price Prediction: POL (Prev. MATIC) Bulls Seem to Possess Strong Momentum (Daily Chart)
Buying activity in the POL (prev. MATIC) market remains robust, keeping price action on a sustained upward path. This bullish bias persists despite the clearly overbought condition indicated by the SRSI.
The ongoing session, in particular, maintains a strong bullish stance above the 9-day EMA curve. As a result, the corresponding price candle has decisively broken above the $0.1600 level and appears to be targeting the next psychological resistance.
POL/USDT Price Prediction: POL (Prev. MATIC) Bulls Are Progressing (4-Hour Chart)
Buyers in the POL (prev. MATIC) market continue to apply upward pressure, pushing price action higher. On the 4-hour chart, the ongoing session remains firmly bullish and positioned above the 9-day EMA curve.
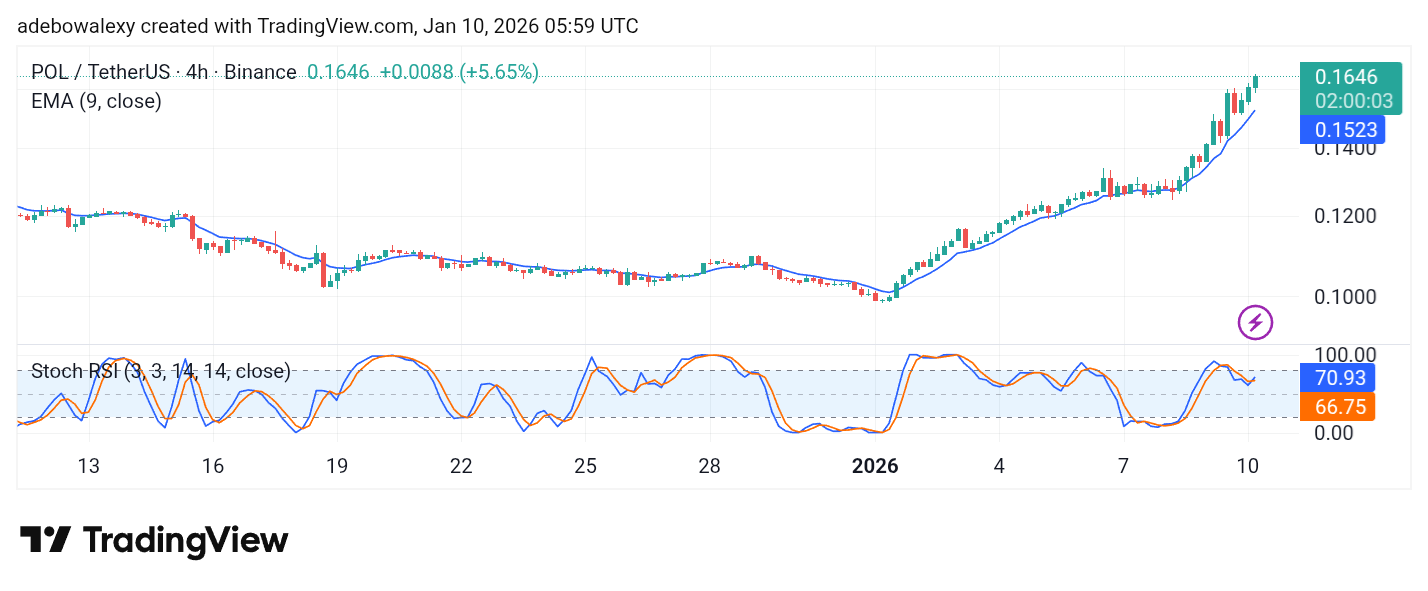
Meanwhile, the SRSI lines had previously descended below the 80 level but have now produced an upside crossover, with the indicator lines turning upward. Since the SRSI has moved back above the 70 level, the short-term outlook appears strong. Therefore, traders may target the $0.1750 and $0.1800 price levels.