Bitcoin (BTC/USD) Trade Hovers Northwardly, Nurturing It
Estimated Reading Time: 3 minutes
Don’t invest unless you’re prepared to lose all the money you invest. This is a high-risk investment and you are unlikely to be protected if something goes wrong. Take 2 minutes to learn more
Bitcoin Price Prediction – November 29
Following the inability of the bears to break against a baseline against the line of $35,000, the BTC/USD trade has pushed positively as the crypto coin hovers northwardly toward the resistance of $40,000, nurturing it as of the time of writing this article.
Around the value line of $38,063.98, sellers are still up against the market’s favorable factors while maintaining a minute percentage rate of 0.58. As long as there is no sharp decline against the $35,000 mark, the current buying gravitational pressures are expected to remain steady in the direction of trying to break through varied overhead resistances. This is especially true when the upper edge of the Bollinger Band indicator stretches upward.
BTC/USD Market
Key Levels:
Resistance levels: $40,000, $42,500, $45,000
Support levels: $35,000, $32,500, $30,000
BTC/USD – Daily Chart
The BTC/USD daily chart reveals that the cryptocurrency trade hovers tightly northwardly around the sell signal side of the upper Bollinger Band trend line, nurturing it.
The stochastic oscillators are holding pushes to the north between the values of 40 and 80. The Bollinger Band trend lines are tentatively placed on the north side, closely below the resistance value of $40,000. The formational pattern of the candlesticks around the upper line of the indicators is suggesting that a bullish-trading consolidation style is likely to play out unabated for some times.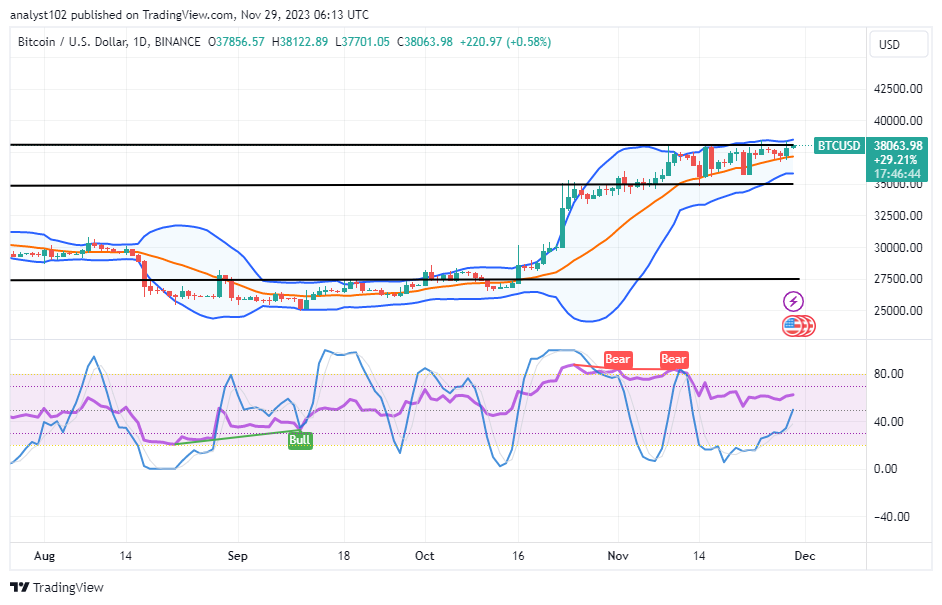
Where is the major trade resistance line of the BTC/USD market to watch out for as it bargains around $38,063.98?
It has been established that some of the ups and downs that have featured in the BTC/USD market operations are to make a sustainable breakthrough against the barrier-trading line of $40,000 as the crypto economy hovers northwardly, nurturing it to the point.
In order to stay outside the clearly defined range-bound zones of $37,500 and $35,000, bulls are gaining a little bit of muscle. The lower-range trade zone has been highlighted as the vital support line that buyers should be wary of allowing fall-offs to occur.
It is advised that bears wait patiently to execute new orders for shorting positions rather than checking the stochastic oscillators’ overbought reading situation. Aside from that likely situation, there has also been active price activity that suggests the price is dropping due to a rejection that surfaced prior to the market opening.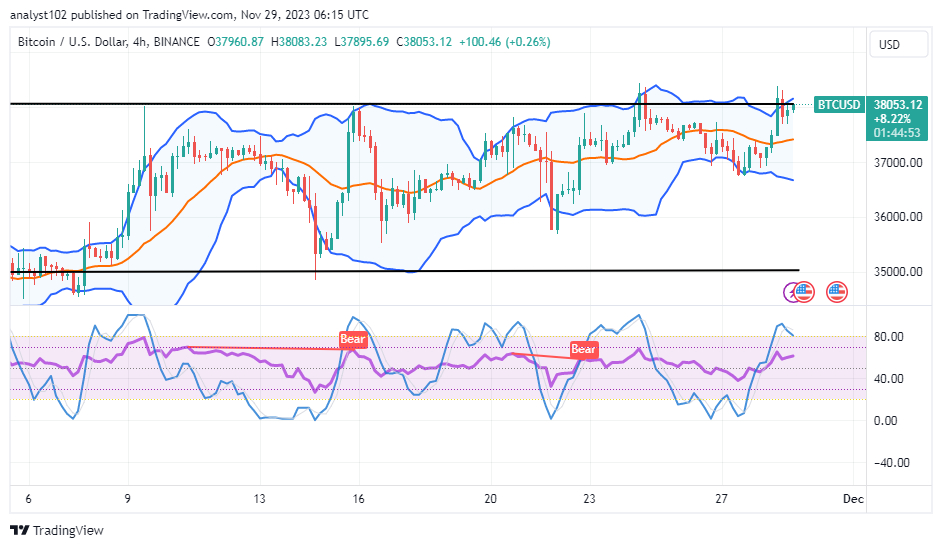
BTC/USD 4-hour Chart
The BTC/USD 4-hour chart showcases the cryptocurrency trade hovering northwardly, nurturing it around the line of the upper Bollinger Band.
With candlesticks around the top line of the indicators, the Bollinger Band trend lines are comparatively placing northbound.The stochastic oscillators are crossing southward, indicating that buying activity will most likely quickly give way to a downward-shifting motion.
Note: Cryptosignals.org is not a financial advisor. Do your research before investing your funds in any financial asset or presented product or event. We are not responsible for your investing results.
You can purchase Lucky Block here. Buy LBLOCK