Uniswap (UNI/USD) Trade Strives for Rises, Basing on $10
Estimated Reading Time: 3 minutes
Don’t invest unless you’re prepared to lose all the money you invest. This is a high-risk investment and you are unlikely to be protected if something goes wrong. Take 2 minutes to learn more
Uniswap Price Prediction – March 28
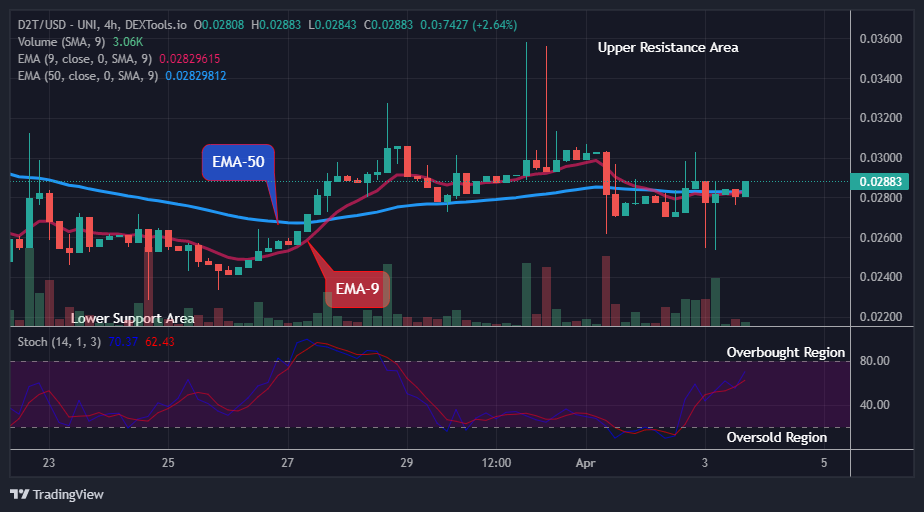
A positive change in the exchange lines that include the worth of Uniswap versus the valuation of the US Dollar has been in a low-to-increasing mode, given that the price currently strives for rises based on $10.
In order for bulls to gain strength and sustain the ensuing gains, the middle Bollinger Band trend line is currently acting as a significant barrier trading zone. It would be essential to monitor the real point at about $12. Consequently, any attempt to allow bears to cross that boundary may result in the lower $10 baseline being revalidated.
UNI/USD Market
Key Levels:
Resistance levels: $14, $15, $16
Support levels: $10, $9, $8
UNI/USD – Daily Chart
The UNI/USD daily chart reveals that the crypto-economic market strives for rises based on the $10 bargain line.
The stochastic oscillators have been managing to conjecture a trending curve to the northbound, placing around a point a bit above the line of 40. The Bollinger Band trend lines are in a systemic state of positioning around the values of $16 at the upper end and $10 at the lower part to showcase the real values within which ups and downs have been mentioned.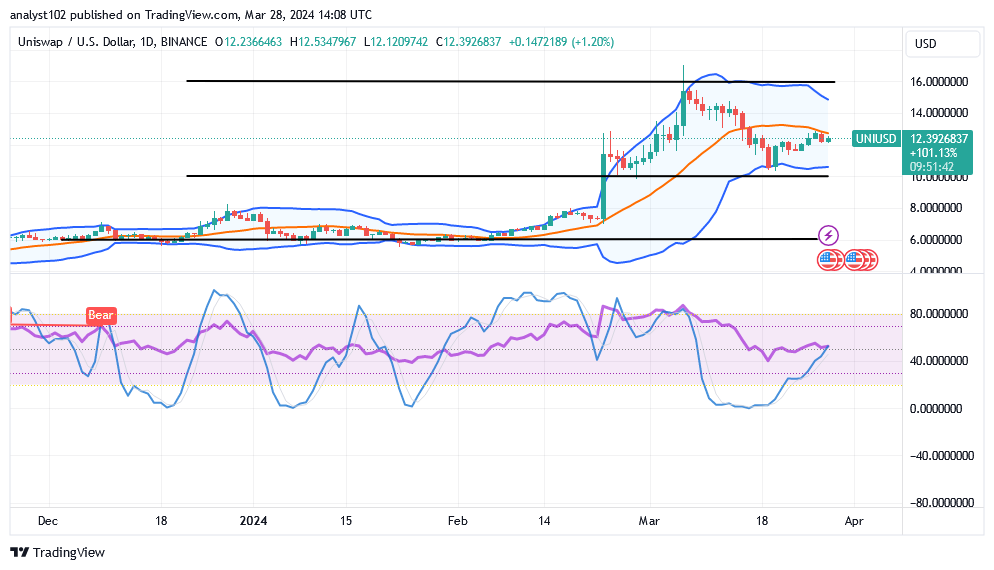
Should investors hold off until the market starts to move back south along the lower Bollinger Band’s zones?
Capitalists may have to wait a while to see that there will be an active reversal of any attempted fearful drawback in the market operations of UNI/USD around the point of the lower Bollinger Band as the price strives to rise, based on the value of $10.
Bulls should stick to their positions next to the yearning wall of a bullish candlestick that emerged from the lower Bollinger Band indicator, as it has been technically illustrated. Any inclination to actively impede it in the near future will expose the market’s base mode to more difficult recoveries.
The middle Bollinger Band’s trend line has demonstrated a tendency to indicate rejection, so the critical imaginary barrier line for the indicator is situated at $14. In the event that a stronger pushing factor is discovered, bears should take caution before taking a new position at $16.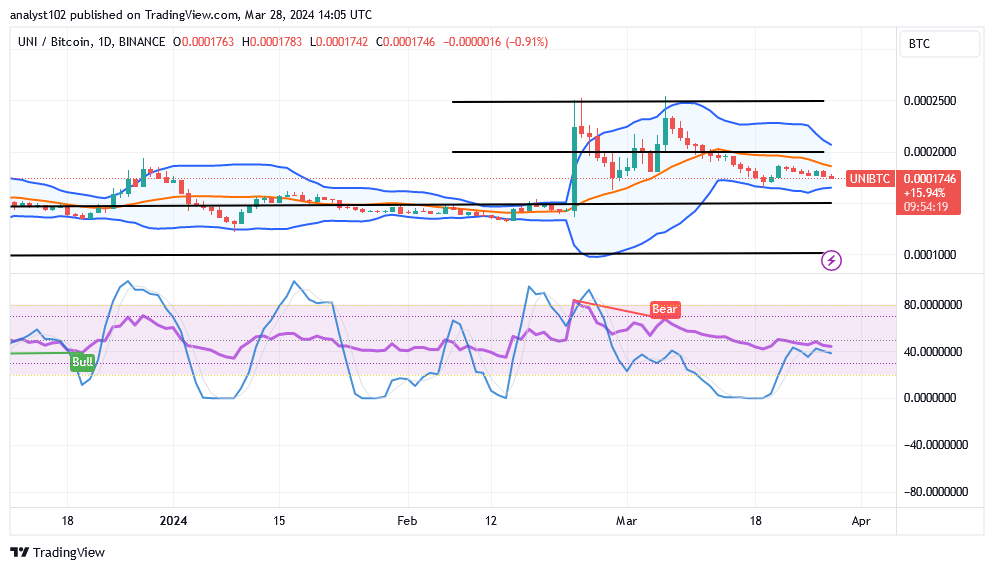
UNI/BTC Price Analysis
In contrast, the Uniswap market is striving toward basing on a zone from the zone of buy signal of the lower Bollinger Band against the worth of Bitcoin.
The stochastic oscillators are stationed strategically to denote that a reversion style is thriving tentatively as of the time of this analysis. The Bollinger Band indicators are having their muffle trend line positioning with a slight downward bend over the candlesticks. Variant indicators are yet indicating that a shift of points to a decrease side is bound to be for a while.
\
Note: Cryptosignals.org is not a financial advisor. Do your research before investing your funds in any financial asset or presented product or event. We are not responsible for your investing results.
You can purchase Lucky Block here. Buy LBLOCK