Solana (SOL/USD) Price Faces a Correction, Building a Base
Estimated Reading Time: 3 minutes
Don’t invest unless you’re prepared to lose all the money you invest. This is a high-risk investment and you are unlikely to be protected if something goes wrong. Take 2 minutes to learn more
Solana Price Prediction – March 22
In the wake of showcasing that some uprising forces that have been put in place by bulls against bears in the last couple of sessions have now been resorting to another round of formation, given that the SOL/USD rade currently faces a correction, building a bear.
The horizontal line and the middle Bollinger Band have formed a tight combination positioning state as of the writing of this analysis, potentially providing support for the basis-finding process that the price has started in anticipation of the $160 mark. A touch of the area is needed to play out coupling with a rebounding move to get a decent longing entry.
SOL/USD Market
Key Levels:.
Resistance levels: $200, $220, $240
Support levels: $150, $130, $110
SOL/USD – Daily Chart
The SOL/USD daily chart reveals that the crypto-economic market faces a correction, building a base above the value of $160.
The stochastic oscillators have crossed southbound from higher-trading zones to place relatively in the oversold region. The Bollinger Band trend lines have been stretching to the north side, with a forcing sign being placed in the north direction. The lower part of the indicators is positioned around $120, making it the most critical line to the downside. 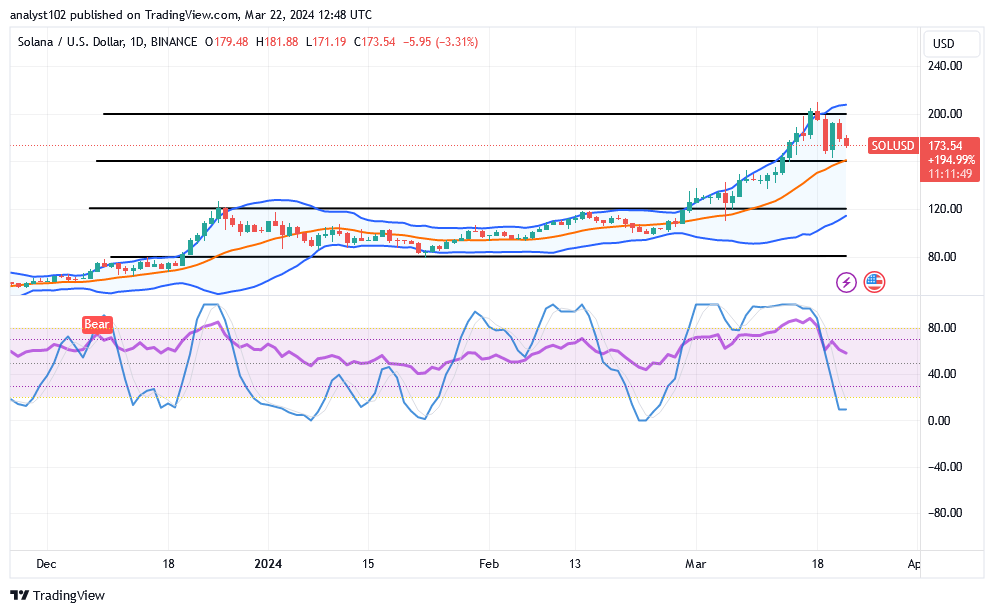
As the price hovers at $173.54, what trade position does the SOL/USD trade typically maintain?
A look at the stochastic oscillators as they have dipped the blue line partially into the oversold region has raised a significant sign toward securing lesser forces to the downside, given that the SOL/USD market faces a correction, building a base.
For buyers, it would be a wise trade strategy to focus on recovering catalysts around the middle of the Bollinger Band most of the time. The lower Bollinger Band trade arena seems to be the place to protect their positions as part of the base-formation process.
The current state of affairs indicates that the resistance point around $200 appears to be the line of correctional motions that stands in the way of more steady advances. Should that be the case, more selling activity would need to occur in order to refute any bullish running pattern that could surface thereafter toward the value line.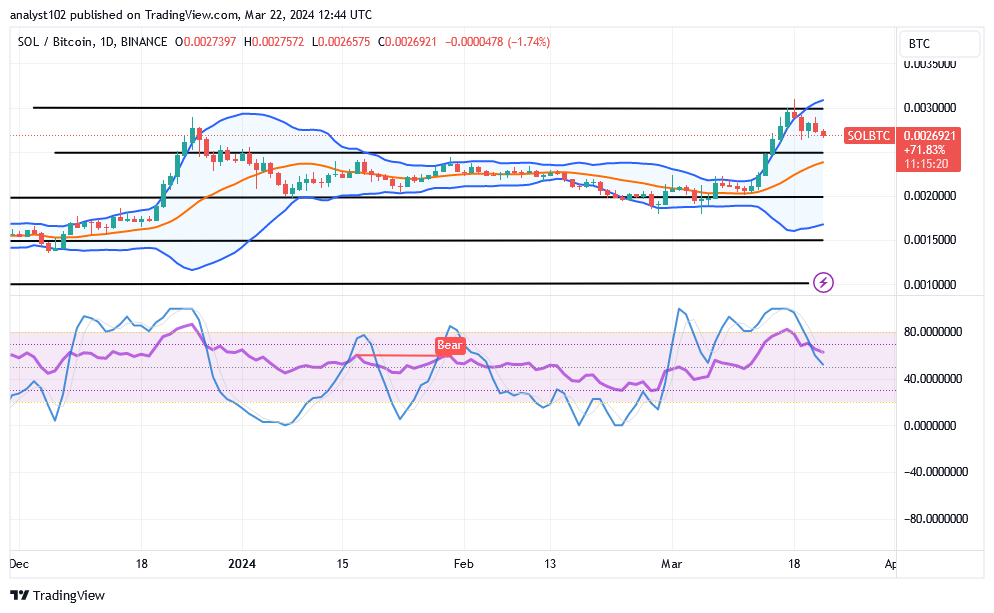
SOL/BTC Price Analysis
In contrast, the market operations of Solana against the valuation of the American currency are facing a correction with a lower sign to start building a base in the near future.
By constructing several strategic locations around each indicator pathway, the Bollinger Bands are extensively opened to highlight areas where price movements are expected to occur. The stochastic oscillators have tentatively crossed to the south, close to 40. The basic crypto economy may need to hold out on initiating a lengthy position order until the oscillators cross back higher with a bullish candlestick.
Note: Cryptosignals.org is not a financial advisor. Do your research before investing your funds in any financial asset or presented product or event. We are not responsible for your investing results.
You can purchase Lucky Block here. Buy LBLOCK