Solana (SOL/USD) Price Springs Up, Sequence to a Fall
Estimated Reading Time: 3 minutes
Don’t invest unless you’re prepared to lose all the money you invest. This is a high-risk investment and you are unlikely to be protected if something goes wrong. Take 2 minutes to learn more
Solana Price Prediction – March 8
The overall price action prevalence trend in the exchanging lines between Solana and the US Dollar shows that bulls are on top of the game, given that the crypto-economic trade has sprung up, leading to a fall toward the lower support of $100.
The present positive pushes obtained ranged from $110 to $100, as it was anticipated that the SOL/USD market long-position pushers would need to maintain their raising capacity pace above those areas. As it stands, bulls are flexing to show that they have the ability to move in a consolidation pattern going forward.
SOL/USD Market
Key Levels:.
Resistance levels: $150, $160, $170
Support levels: $120, $110, $100
SOL/USD – Daily Chart
The SOL/USD daily chart reveals that the crypto market springs up, leading to a fall that produces a move toward the point of $100.
A decline candlestick that occurred on Tuesday’s sessions eventually reverted to a reversion that led to the formation of another bullish candlestick in the day that followed. The Bollinger Band indicators have been helpful by providing notable space between the upper and middle trend lines. The stochastic oscillators have remained swerving around the points of 80 into the overbought to indicate that buyers are running a consolidation style. 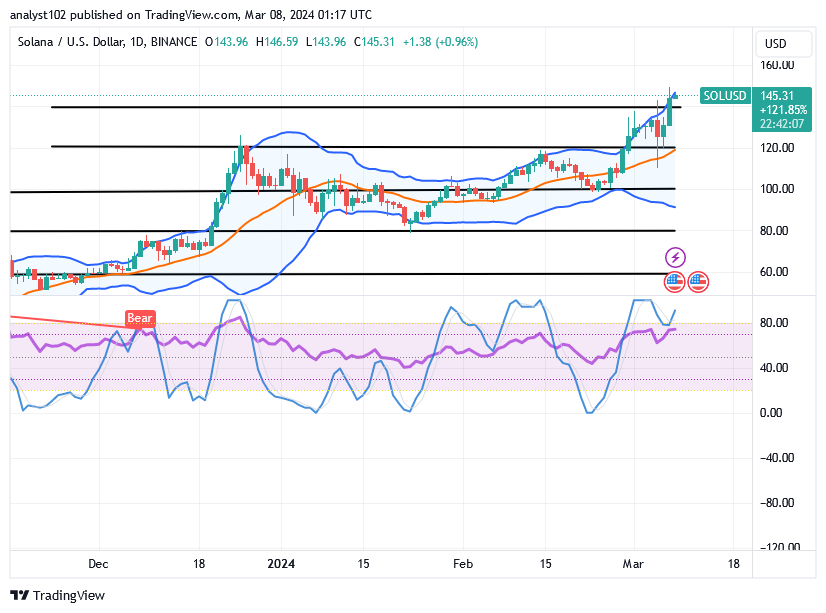
What hurdle does the SOL/USD trade typically turn to as it starts to decline?
It has been established that bulls are consolidating their stances in the SOL/USD market operations, as the situation currently has it that the price springs up, leading to a fall that averaged the line of $100.
A systemic rallying motion to overcome varying higher resistances may be produced by a further northward climb between $135 and $145. Bulls, however, need to exercise caution in the event of an abrupt reversal with considerable volatility.
Before placing a shorting position order, sellers would need to be alert for when there will be a quick, scary climb combined with a timely reversal moving style. Execution of immediate shorting orders should not be considered until about two 1-hour candlesticks have formed at higher zones, should that assumption prove to be correct.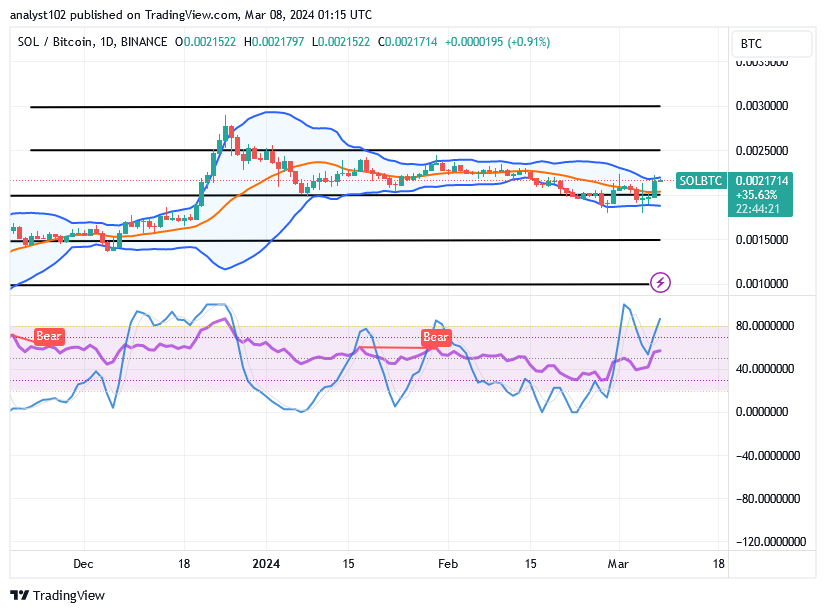
SOL/BTC Price Analysis
In contrast, the Solana trade springs up against Bitcoin, leading to a fall across the trend line of the middle Bollinger Band.
The trend lines of the Bollinger Bands are pointing slightly downward, suggesting the formation of a bullish flag shape. Right now, the stochastic oscillators are shifting from a touch of their second part around 55 to the upside of their blue portion. That demonstrates the persistence of buying forces.
Note: Cryptosignals.org is not a financial advisor. Do your research before investing your funds in any financial asset or presented product or event. We are not responsible for your investing results.
You can purchase Lucky Block here. Buy LBLOCK