Solana (SOL/USD) Trade Averages $140, Has to Stay Above $110
Estimated Reading Time: 3 minutes
Don’t invest unless you’re prepared to lose all the money you invest. This is a high-risk investment and you are unlikely to be protected if something goes wrong. Take 2 minutes to learn more
Solana Price Prediction – March 1
The positive pushing capacity pace in the market activities of Solana versus the valuation of the USD dollar has been steadily carried out as the crypto trade averages the resistance line of $140, which it has to keep above $110.
Variant candlesticks have been used to illustrate the persistence of buying pressure at the expense of bear market weaknesses. As things stand, in order to prevent needless whipsawed negotiation conditions, long-position movers should also be cautious about acting suddenly in conjunction with the current increasing pressure status.
SOL/USD Market
Key Levels:.
Resistance levels: $120, $130, $140
Support levels: $110, $100, $90
SOL/USD – Daily Chart
The SOL/USD daily chart reveals that the crypto-economic market averages the resistance point of $140, as it has to keep above $110.
The Bollinger Band trend lines are striving to get repositioned to the upside from the point of $120, leaving the lower part to station at $100. The stochastic oscillators are having their blue part trending high to the north in the overbought region, affirming that the rate forces that the base has put up with are still stronger than what the capacity of counter crypto can curtail at the time of the piece.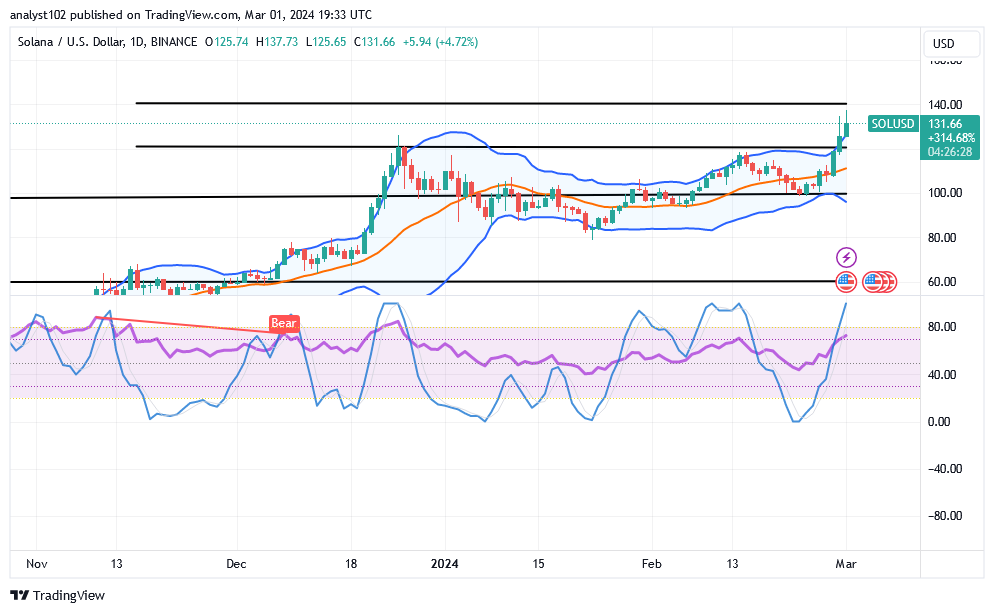
As the SOL/USD market averages the $140 mark, is there a possibility of a profiteering condition over that point?
A quick rebounding force toward the line of $140 may potentially result in an unnecessary increase, especially if the price tends to go into a long reversal moving mode, as the SOL/USD trade averages the $140 resistance as it has to stay above $110.
Buyers may still participate in active bullish movements because there is a circumstance to support an overbought reading condition, as long as the bottom of any daily candlestick that may have been formed isn’t broken at the end of the day.
Psychologically speaking, it is okay for bears to wait for a reversal trend motion to surface around the upper Bollinger Band to recoup their stance. Nevertheless, if the subsequent operations keep reoccurring in favor of the north side, sellers will have to look into other higher resistance trade spots.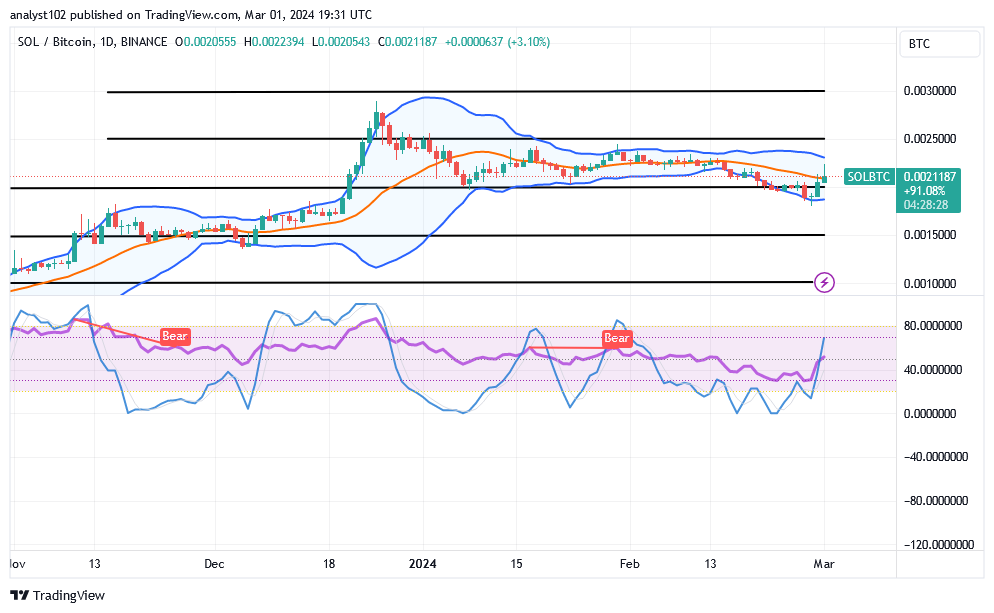
SOL/BTC Price Analysis
In contrast, the Solana market is pushing northward at the middle Bollinger Band trend line, as it has to stay above $110.
There is currently a line of surges from the lower to the northern side of the Bollinger Band trend lines. The stochastic oscillators are closing the gap ranges close to the 80th point by veering to the north. It seems that in the upcoming events, the basic cryptocurrency is competing with its counterpart by using wax muscles.
Note: Cryptosignals.org is not a financial advisor. Do your research before investing your funds in any financial asset or presented product or event. We are not responsible for your investing results.
You can purchase Lucky Block here. Buy LBLOCK