Solana (SOL/USD) Trade Places Below $120, Tending a Correction
Estimated Reading Time: 3 minutes
Don’t invest unless you’re prepared to lose all the money you invest. This is a high-risk investment and you are unlikely to be protected if something goes wrong. Take 2 minutes to learn more
Solana Price Prediction – February 16
Over time, the upholding of rising gravitation is on the verge of exhaustion as the SOL/USD market places below the resistance line of $120, tending to a correction.
Given the current indicators’ reading outlook, the majority of the tools are positioned in an overbought area, indicating that further movements will expose them to vulnerable constraints. The middle Bollinger Band’s trend line must serve as the point at which buyers must regain momentum, with the $100 line serving as the pivot point against any attempt to move lower in the near future.
SOL/USD Market
Key Levels:.
Resistance levels: $120, $130, $140
Support levels: $80, $75, $70
SOL/USD – Daily Chart
The SOL/USD daily chart showcases the crypto market places below $120, tending a correction underneath the upper Bollinger Band.
The Bollinger Band indicators are being placed northwardly to produce a pathway to the upside. In the meantime, the use of candlesticks has been briefly indicating that the motions are liable to go down. The stochastic oscillators have been placed slowly toward the south to show that buyers’s reactions are on the verge of losing their stance soon.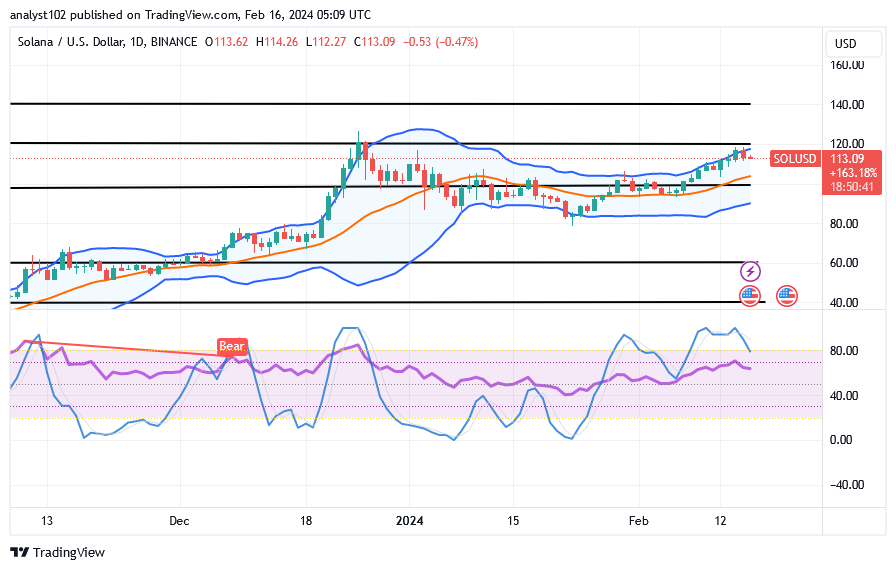
Do any indicators point to the potential purchasing window opening up while the SOL/USD market hovers around $113.09?
As this analytics is showing, there have been no significant signs to foretell formidable further rises through the line of $120, as the SOL/USD trade places below it, tending a correction.
A move to the downside is likely to stage to allow purchasers to go for a reset of regaining momentum in the areas between the trend lines of the upper and middle Bollinger Bands. Therefore, bulls are expected to hold back from taking more positions for a while.
A crypto signal has emerged to bolster the possibility that the market won’t break beyond $120. The market force’s close technical analysis reveals that there is insufficient gravitational pressure to execute a quick position order. The stochastic oscillators will play a crucial role in invalidating the smooth entry of subsequent shorting entries as they move into lower zones.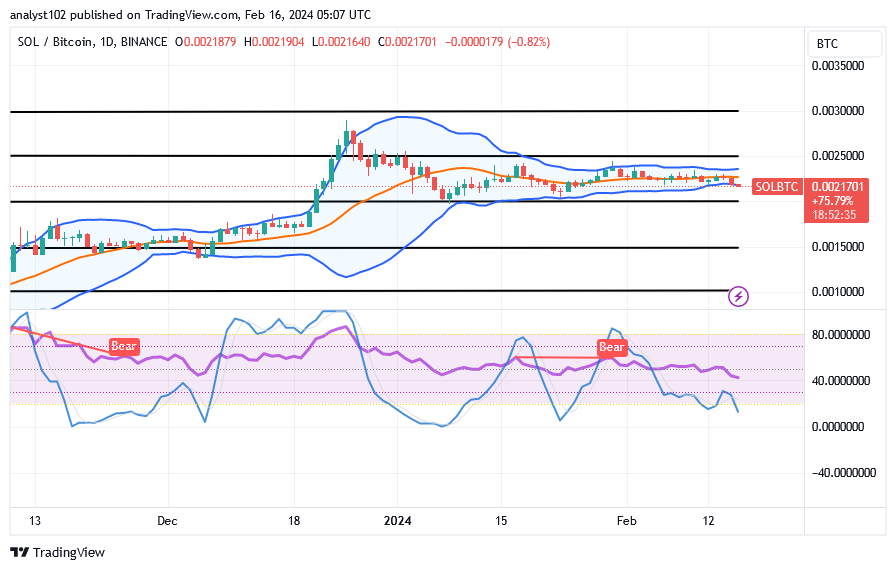
SOL/BTC Price Analysis
In contrast, the Solana ‘trade places against the valuation of Bitcoin in a decline format, tending to a correction around the lower Bollinger Band.
The stochastic oscillators have been confirming that bulls have not yet awoken from debasement processes by consolidating in the oversold area. The trend lines of the Bollinger Band are positioned deliberately at higher trade zones, indicating specific sides that will either go up or down in the aftermath of operations. Shorting operations should not be conducted in conjunction with the current bearish candlestick.
Note: Cryptosignals.org is not a financial advisor. Do your research before investing your funds in any financial asset or presented product or event. We are not responsible for your investing results.
You can purchase Lucky Block here. Buy LBLOCK