Tamadoge (TAMA/USD) Bulls Recongregate at $0.00847 as They Plan to Reclaim $0.0090
Estimated Reading Time: 3 minutes
Don’t invest unless you’re prepared to lose all the money you invest. This is a high-risk investment and you are unlikely to be protected if something goes wrong. Take 2 minutes to learn more
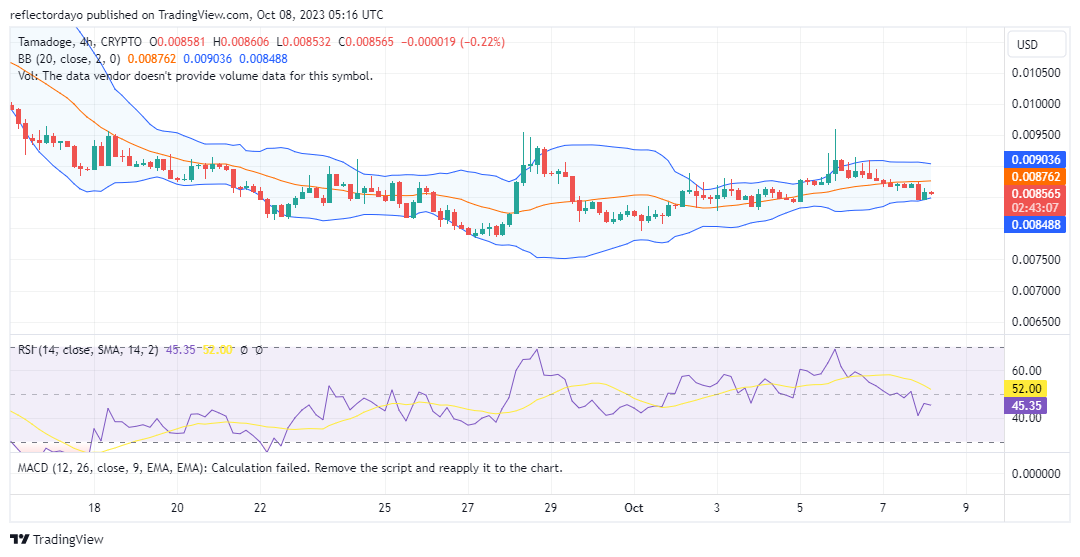
On October 5th, the Tamadoge market reached its peak at a price level of $0.0096, subsequently signaling the onset of a bearish trend. The support level of $0.00847 served as the point of origin for the preceding bull market. However, the prevailing selling pressure has compelled buyers to converge once again at this very support level as the bull market prepares for a potential retracement toward the $0.009 price range.
Key Levels
- Resistance: $0.013, $0.014, and $0.015.
- Support: $0.00800, $0.0075, and $0.0073.
TAMAUSD Price Analysis: The Indicators’ Point of View
The Bollinger Bands indicator continues to depict an upward-trending price channel, despite the price action dipping below the 20-day moving average. The lower standard deviation remains relatively unaffected, thanks to the buyers’ ability to sustain the market around the support level of $0.00847.
However, it appears that the Tamadoge bull market may be encountering resistance prematurely. If buyers are unable to overcome this resistance, there is a possibility of the market consolidating at this price level. Traders should remain vigilant and closely monitor market developments.
Given the buyers’ success in rebuffing bearish price movements, initiating a market turnaround should not pose a significant challenge as the new week commences.

Tamadoge Short-Term Outlook: 1-Hour Chart
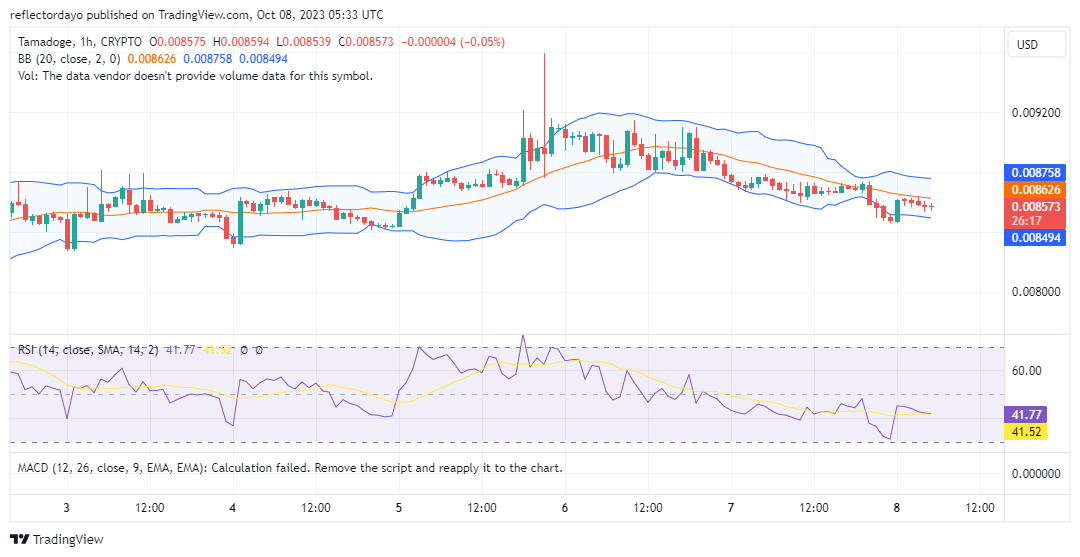
Upon examining the 1-hour chart perspective, it becomes evident that the market has encountered resistance at $0.00862 earlier than expected. This indicates a lingering bearish sentiment that bullish traders must contend with as they endeavor to steer the market in a more favorable direction.
While the 4-hour chart displays an overall upward trend in the price channel, the 1-hour chart presents a contrasting, downward-leaning pattern. Notably, recent candlesticks exhibit doji formations, suggesting a temporary equilibrium between supply and demand forces.
Classic arcade games at your fingertips, play to earn.
Play to earn classic arcade games at your finger tips ✌️
Download Tamadoge Arcade and earn $TAMA now 👇
📱 Android: https://t.co/3PXpfUBjQh
📱 iOS: https://t.co/UN5MlRGOTC pic.twitter.com/RtVliC25nu— TAMADOGE (@Tamadogecoin) October 7, 2023
Do you want a coin that will be 100 times more valuable in the next few months? That is Tamadoge. Buy TAMA today!