Tamadoge (TAMA/USD) Demonstrates Increasing Bullish Momentum
Estimated Reading Time: 3 minutes
Don’t invest unless you’re prepared to lose all the money you invest. This is a high-risk investment and you are unlikely to be protected if something goes wrong. Take 2 minutes to learn more
The Tamadoge market has demonstrated its ability to secure higher support levels following each retracement triggered by encounters with bearish resistance. While the journey has not been without its challenges, the bulls have persevered, carrying the burden of overcoming bearish pressure. This market has witnessed substantial conflicts between demand and supply forces; however, it is notable that the demand side currently holds a favorable position.
Key Levels
- Resistance: $0.013, $0.014, and $0.015.
- Support: $0.00800, $0.0075, and $0.0073.
TAMAUSD Price Analysis: The Indicators’ Point of View
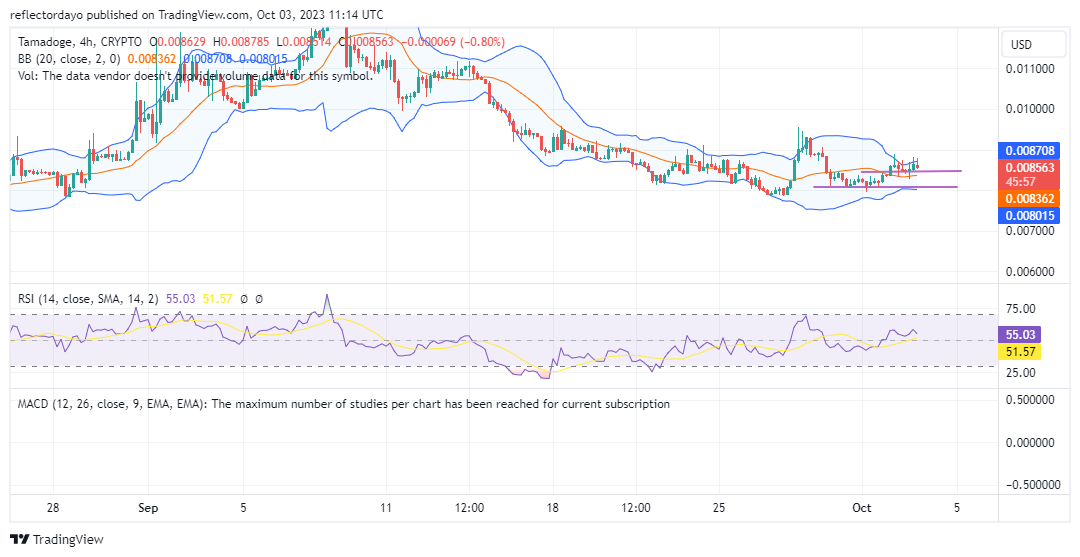
As September drew to a close, the Tamadoge market found itself in a consolidation phase around the $0.0081 price level. However, with the onset of October, a noticeable uptick in momentum has emerged, leading to the establishment of a new support level at $0.00847. Notably, the predominant candlestick patterns observed since September 29 have been spinning tops and long-legged dojis, indicative of a contest between bullish and bearish forces. Yet, the recent upward momentum suggests that the bulls are currently in the ascendancy.
This ongoing struggle between market participants has been reflected in the Bollinger Bands, which, until recently, remained relatively contracted, with their bands failing to exhibit significant divergence. However, as of October 2, the intensified bullish activity has begun to impact the upper bands of the Bollinger Bands indicator, signaling a potential resolution of the previous deadlock.

Tamadoge Short-Term Outlook: 1-Hour Chart
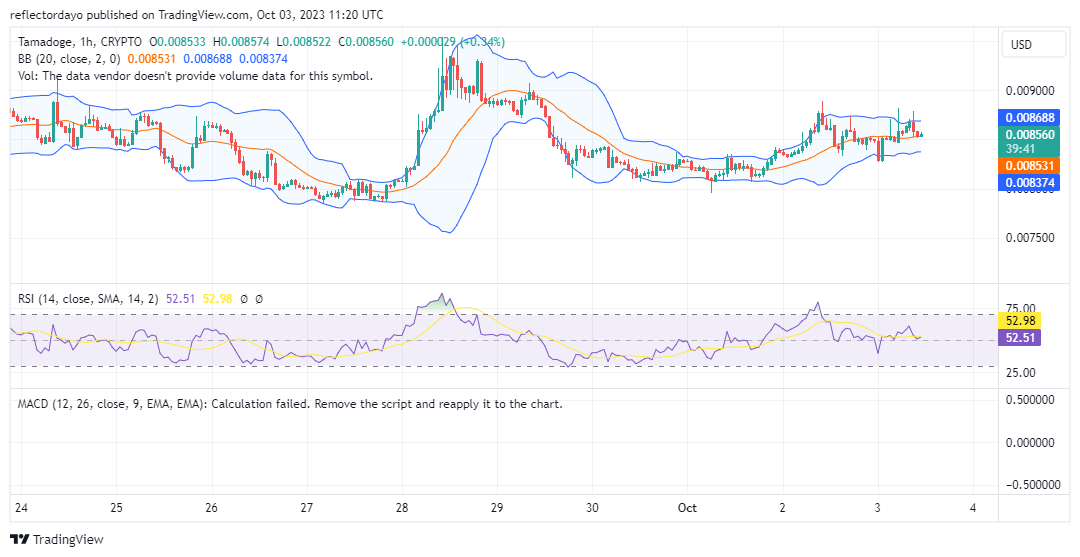
Since October 2nd, a robust resistance level has solidified at the $0.00878 price point, evident in its ability to effectively repel market advances when viewed through a 1-hour timeframe. Nevertheless, the bull market exhibited resilience, rebounding from the $0.0083 support level and mounting pressure on the resistance barrier.
The current testing above the resistance level by the bull market signifies increasing pressure on the bearish stance, potentially paving the way for a shift in market sentiment favoring the bulls. As the market dynamics evolve, the next potential target may materialize at the $0.009 price level.
Stay tuned to the Tamadoge social media, where you can be updated on the latest developments for the next Tamadoge release.
Now that we’ve launched Pet Store, we’re getting ready to unveil Mystery Project 5 🎉
Stay tuned to our socials to be the first to hear the latest updates on our next Tamadoge release 🐶 pic.twitter.com/5NSr6AISSF
— TAMADOGE (@Tamadogecoin) October 2, 2023
Do you want a coin that will be 100 times more valuable in the next few months? That is Tamadoge. Buy TAMA today!