Tamadoge (TAMA/USD) Engages in Consolidation Around $0.0086 to Bolster Support Level
Estimated Reading Time: 3 minutes
Don’t invest unless you’re prepared to lose all the money you invest. This is a high-risk investment and you are unlikely to be protected if something goes wrong. Take 2 minutes to learn more
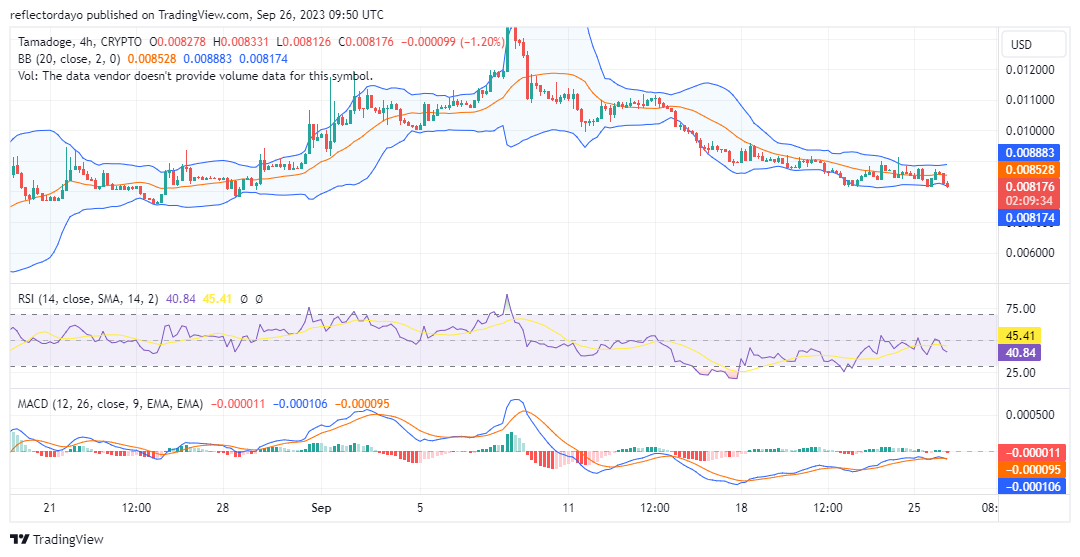
TAMA/USD is currently exhibiting a price consolidation pattern, with its price fluctuating within the $0.009 and $0.008 price ranges, centered around the $0.0086 mark. This price action reflects a reduction in trading volume, often considered a precursor to a noteworthy directional move in the market.
Furthermore, the market is hovering in close proximity to the support level established on August 28, which served as a foundational point for the substantial bullish trend observed in September. As a result, there is potential for a price rebound from this level.
Key Levels
- Resistance: $0.013, $0.014, and $0.015.
- Support: $0.00800, $0.0075, and $0.0073.
TAMA/USD Price Analysis: The Indicators’ Point of View
While the $0.0080 price point is recognized as a pivotal support level, a slightly elevated support level materialized at $0.0082 during the weekend. Presently, this recently established support level is facing downward pressure from bearish market forces. In the event of a breach of this support, attention may shift to the critical support at $0.008. Interestingly, even a substantial TAMA/USD bearish breakout could potentially serve as a catalyst for a bullish market resurgence, akin to the scenario observed in late August.
Historical analysis suggests that the breach of the key support level often paves the way for a significant bullish market movement.

Tamadoge Short-Term Outlook: 1-Hour Chart
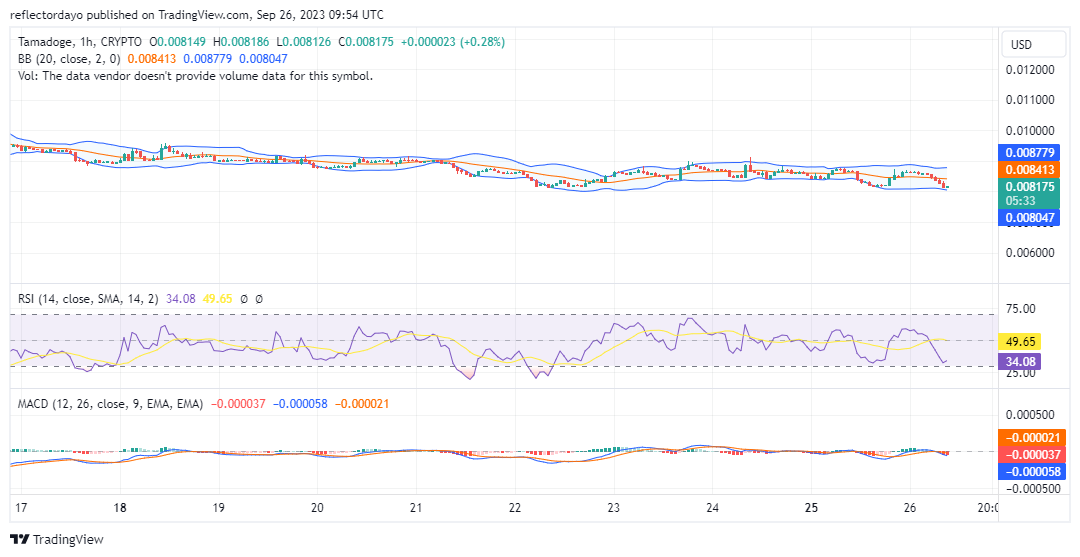
Upon examination of the 1-hour chart, it becomes evident that bullish market participants are endeavoring to maintain the $0.0082 support level. Consequently, the Bollinger Bands indicator reflects a relatively stable horizontal price channel. In tandem, the Relative Strength Index (RSI) signifies the bullish commitment to sustain this marginally higher support level, as evidenced by the upward trajectory of the RSI line.
The burning of $TAMA is in 3 days.
Set your calendars 🗓️
We’re burning $TAMA in 4 days. Keep track on our Burn Portal 👉 https://t.co/CweV78geeJ pic.twitter.com/WZaP1S0dH3
— TAMADOGE (@Tamadogecoin) September 25, 2023
Do you want a coin that will be 100 times more valuable in the next few months? That is Tamadoge. Buy TAMA today!