Polkadot Declines to $6.82 Low as Buyers Defend Current Support
Estimated Reading Time: 3 minutes
Don’t invest unless you’re prepared to lose all the money you invest. This is a high-risk investment and you are unlikely to be protected if something goes wrong. Take 2 minutes to learn more

Free Crypto Signals Channel
Polkadot (DOT) Long-Term Analysis: Bearish
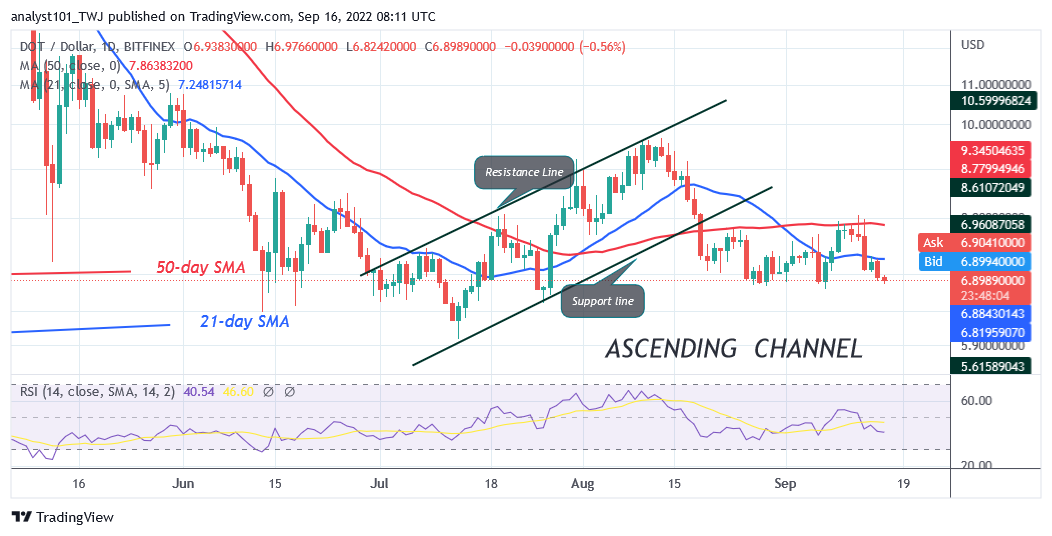
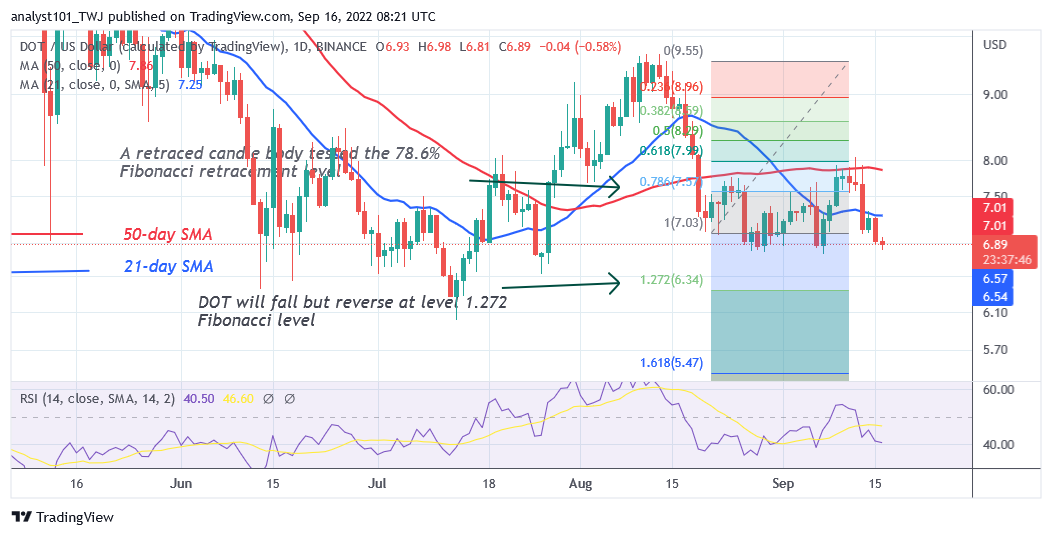
Polkadot’s (DOT) price is in a downtrend as buyers defend current support. The cryptocurrency has retested the previous low on three occasions after its rejection at the overhead resistance at $9.64. On the upside, buyers have made attempts to keep the price above the 50-day line SMA or the $8.00 resistance but were repelled. On each rejection, the altcoin would decline above the $6.00 support. A break above the recent high will catapult the altcoin to the high of $9.64. Sellers will take control if buyers fail to breach the recent high. Today, the altcoin has fallen to the low of $6.82 as sellers attempt to sink it . DOT price will further decline to the previous lows at $5.98 if the selling pressure persists. Conversely, if Polkadot rebounds and breaks the 21-day line SMA, the altcoin will rise to the 50-day line SMA. A rally to $10 high is expected if buyers overcome the 50-day line SMA or the $8.00 resistance level.
Polkadot (DOT) Indicator Analysis
Polkadot is at level 39 of the Relative Strength Index for period 14. The cryptocurrency is in the downtrend zone as it approaches the oversold region of the market. The price bars are below the moving average lines which indicates a further decline of the altcoin. The moving average lines are pointing southward indicating the downtrend.
Technical indicators:
Major Resistance Levels – $10, $12, $14
Major Support Levels – $8, $6, $4
What Is the Next Direction for Polkadot (DOT)?
Polkadot has resumed its range-bound move as buyers defend current support. The coin is trading in the oversold region of the market as it resumes upward. The cryptocurrency will be fluctuating between the $6.00 and $8.00 price levels if buyers fail to overcome the recent high.
You can purchase crypto coins here. Buy LBLOCK
Note: Cryptosignals.org is not a 1a financial advisor. Do your research before investing your funds in any financial asset or presented product or event. We are not responsible for your investing results