Bitcoin (BTC/USD) Price Hikes, Hovering at $42,500
Estimated Reading Time: 3 minutes
Don’t invest unless you’re prepared to lose all the money you invest. This is a high-risk investment and you are unlikely to be protected if something goes wrong. Take 2 minutes to learn more

Free Crypto Signals Channel
Bitcoin Price Prediction – March 23
Over a couple of sessions, the BTC/USD market valuation has been some variant movements that currently show that the crypto-economic price hikes to hover around $42,500. The crypto economy is between the high point of $42,571 and a low of $41,794 at a minimal negative percentage of 0.53.
BTC/USD Market
Key Levels:
Resistance levels: $45,000, $47,500, $50,000
Support levels: $40,000, $37,500, $35,000
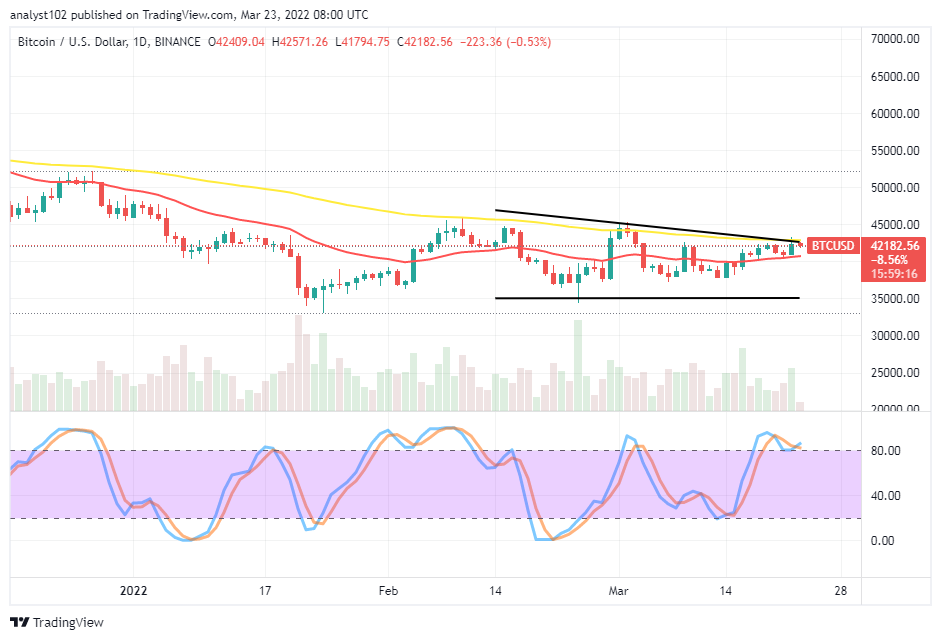
BTC/USD – Daily Chart
The BTC/USD daily chart exhibits the crypto-economic price hikes, hovering at the $42,500 trading level. The bearish trend line drew closely alongside the bigger SMA trend line to indicate how crucial the value line is to determine an order around the spot. The 14-day SMA indicator is underneath the 50-day SMA indicator. The Stochastic Oscillators have slightly crossed southbound in the overbought closely to the range of 80. A tinier bearish candlestick is in the making to signify that there may soon be a downward-returning motion in the business operations.
Can there be a push in the BTC/USD market to obtain higher sustainably over $42,500 as the crypto’s price hikes to hover around it?
The BTC/USD market bulls’ capability to push more as envisaged technically around the $42,500 trading level appears not mustering a reliable force to back a sudden fearful breakout in the aftermath operations as the crypto’s price hikes to hover around the value-line. That assumption is against exertion of further buying orders if a spike occurs against the 50-day SMA trading indicator. The reason is that a quick correction can re-surface in no time to counter the move.
On the downside of the technical analysis, the BTC/USD market bears needed to continue to be on the lookout for active rejections emanating from price action made to push for higher profits around higher resistance trading spots to observe decent sell entries. The value-lines between $42,500 and $45,000 are the core areas around which sell entries can obtain.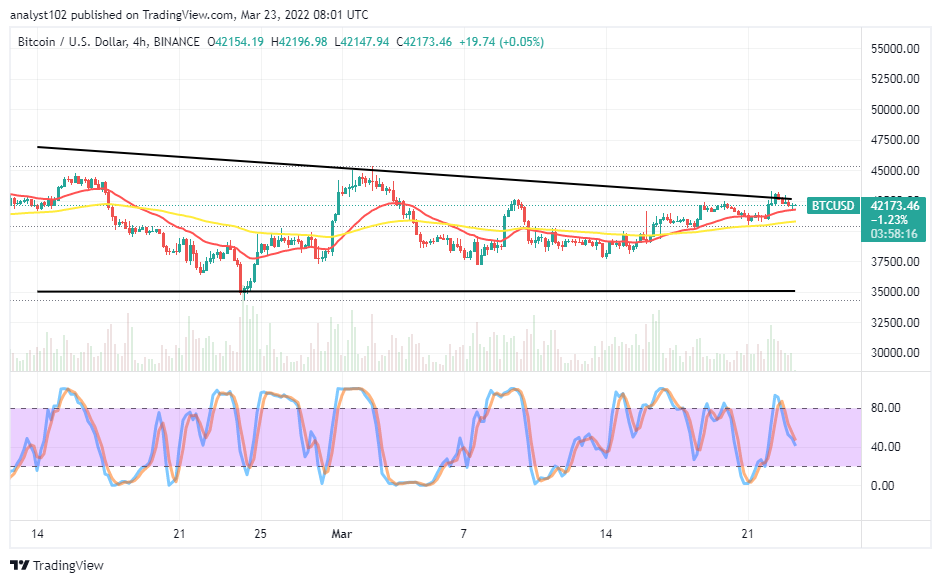 BTC/USD 4-hour Chart
The BTC/USD medium-term chart shows the crypto-economic price hikes, hovering at $42,500 as the bearish trend line drew southwardly to make a mark-down point at the value-line. The 14-day SMA indicator has slightly intercepted the 50-day SMA indicator to the upside. The Stochastic Oscillators have traversed southbound from the overbought region toward the range of 40. That signifies the market won’t hold for long above the value earlier mentioned.
Note: Cryptosignals.org is not a financial advisor. Do your research before investing your funds in any financial asset or presented product or event. We are not responsible for your investing results.
You can purchase Lucky Block here. Buy LBlock: