Bitcoin Cash (BCH/USD) Price Hovers at $600
Estimated Reading Time: 3 minutes
Don’t invest unless you’re prepared to lose all the money you invest. This is a high-risk investment and you are unlikely to be protected if something goes wrong. Take 2 minutes to learn more
Bitcoin Cash Price Prediction – August 27
The BCH/USD price hovers around the trading line of $600. It has been over a couple of sessions that the market has seen, trading around the value. The crypto’s financial book records a percentage increase rate of about 3.20, trading around the level of $625. That gingers the possibility of getting to see some amounts of price increment in the near time
BCH/USD Market
Key Levels:
Resistance levels: $800, $900, $1,000
Support levels: $500, $400, $300
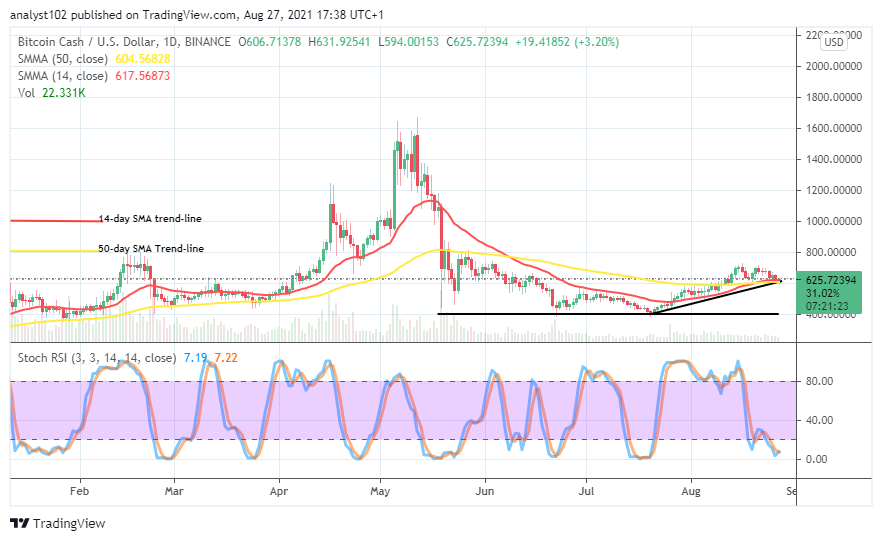
BCH/USD – Daily Chart
It reveals on the BCH/USD daily chart that the crypto’s price hovers around the level of $600. Over some trading days’ sessions, variant Japanese candlesticks have emerged in the market to represent ups and downs between the points of $800 and $600. The long-conjoining position outlook of the 14-day SMA indicator and the 50-day SMA indicator at the smaller value signifies how significant the point is. The bullish trend-line also is drawn to give a continual support posture to the smaller SMA. The Stochastic Oscillators have penetrated the oversold region attempting to signal a probable upside sign.
What could be borne out of the market consolidation movement as the BCH/USD price hovers around $600?
The market consolidation movement could lead to bulls getting strong stances as the BCH/USD price hovers around the level of $600. The point may as well remain in focus as long as less-active price action continues to exert. But, in the meantime, the BCH/USD market bulls are likely to get control of the crypto economy especially, while a line of price pulling downs take place.
On the downside, the downward-pressure capacity the BCH/USD market bears have presently appeared minute. Even in the event of trying, to prolong a kind of price consolidation around the level of $600 may not bring about much profit out of further movements to the downside. Therefore, selling orders could be suspended for a while. The positioning of the Stochastic Oscillators in the oversold region also suggests that the crypto has reached the point that tends not worthy of depreciating further.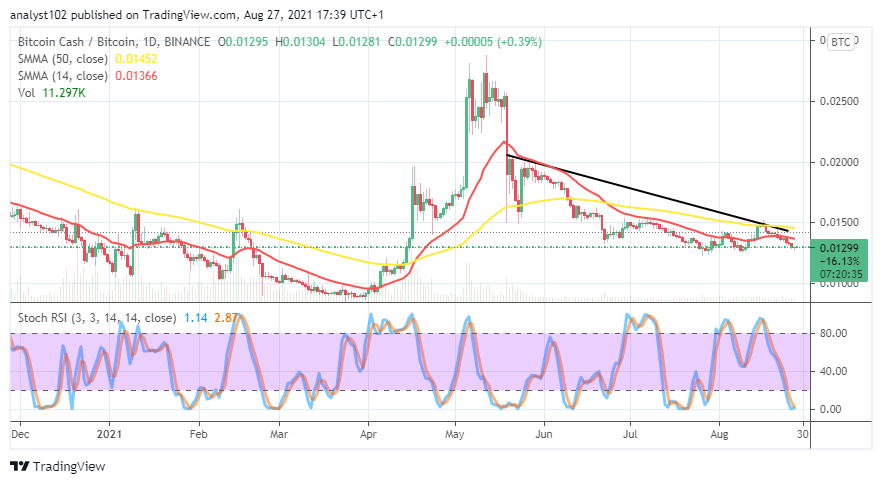
BCH/BTC Price Analysis
It shows on the BCH/BTC price analysis chart that the base crypto succumbs to pressures inflicted upon it by the counter crypto. The 50-day SMA indicator is above the 14-day SMA indicator as the bearish trend-line drew southward above them to the bigger SMA at the extreme side. The short line formation of lighter candlesticks has almost reached the lower zone it did around August 8th or thereabout. The Stochastic Oscillators have dipped into the oversold region to touch the range level of zero. That signifies Bitcoin Cash may soon begin to regain its weight of trending against Bitcoin.
Note: Cryptosignals.org is not a financial advisor. Do your research before investing your funds in any financial asset or presented product or event. We are not responsible for your investing results.
You can purchase crypto coins here. Buy Tokens