Band Protocol (BANDUSD) – Neckline of Double Bottom About to Be Broken
Estimated Reading Time: 2 minutes
Don’t invest unless you’re prepared to lose all the money you invest. This is a high-risk investment and you are unlikely to be protected if something goes wrong. Take 2 minutes to learn more
Band Protocol Market Analysis
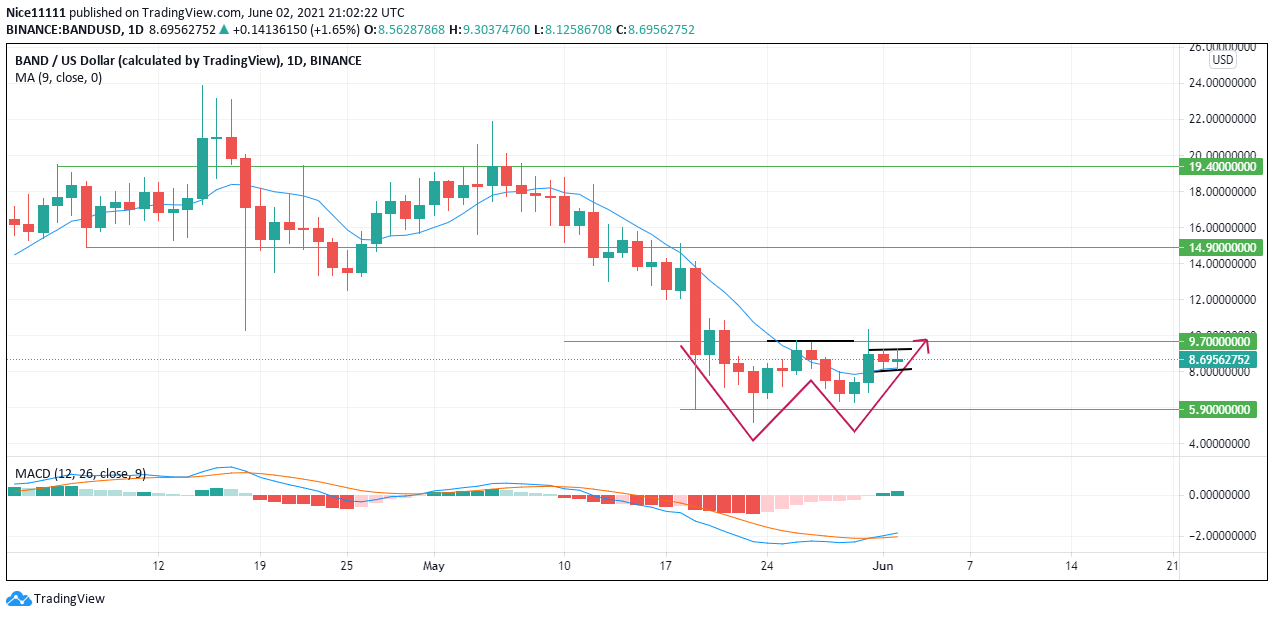
BAND dipped into a support zone at 5.900. It created a low on the 23rd of May. It attempted to rally but it was stopped at 9.700. The supply zone defended further increase in price. The price dropped back into the support zone once again at 5.900 on the 29th of May. The second low formed the second bottom. The double bottom pattern was fully formed on the 31st of May as the market reached the previous resistance at 5.900. The first resistance on the significant zone formed the neckline of the double bottom pattern formed on Band Protocol. 
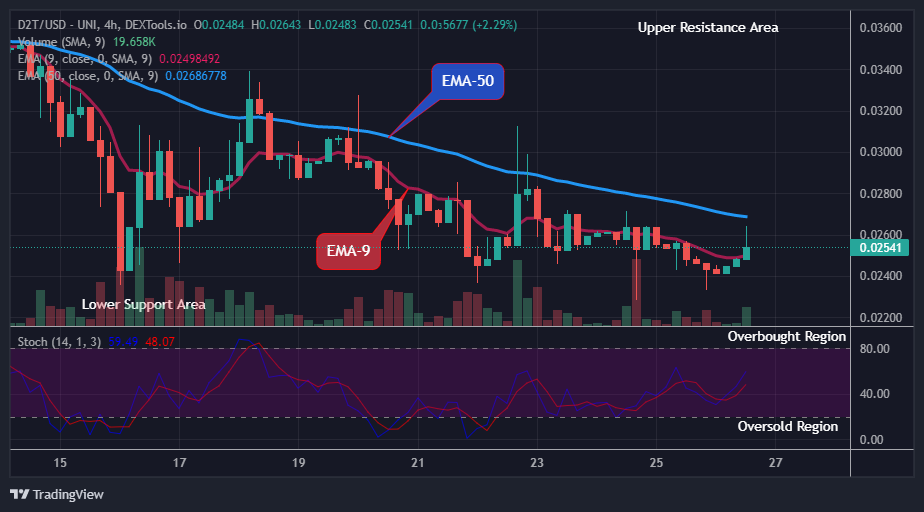
On the Four Hour chart, BANDUSD is seen to form very small candles in consolidation. This is a clear sign of the market preparation to expand aggressively.
Band Protocol Significant Zones
Demand Zones: $14.900, $5.900
Supply Zones: $19.400, $9.700
BAND Market Expectation
On the daily chart, the MACD (Moving Average Convergence Divergence) indicator shows the willingness of price increase in the market. The buy alert of the indicator is seen with its oscillating lines crossing below the midlevel at zero. The cross of the MACD strings is facing higher, aiming to go above the zero level.
The 9 SMA (Simple Moving Average) has switched from acting as resistance to support for the market. The last two candles at the time of writing rest well above the Moving Average.
On the four-hour chart, the MACD indicator shows a momentary drop in price to the lower side of the consolidation. The Moving average has been in a phase of indecision but is currently showing bullishness in price. Price is likely to reach 9.700 after a touch of the lower end of the four-hour consolidation. The market might also reach for the next support zone at 5.900 if the price fails to rally.
Note: new.cryptosignals.org is not a financial advisor. Do your research before investing your funds in any financial asset or presented product or event. We are not responsible for your investing results.