Litecoin (LTC) Price Prediction: LTC/USDT Keeps Falling to Lower Support
Estimated Reading Time: 3 minutes
Don’t invest unless you’re prepared to lose all the money you invest. This is a high-risk investment and you are unlikely to be protected if something goes wrong. Take 2 minutes to learn more

While the big market indicator Bitcoin has been able to recover above the $90,000 mark recently, altcoins such as Litecoin haven’t had the same kind of short-term bullish activity. Instead, the price of the token descended through the $80 mark and continues to reach lower levels.
Date: December 16, 2025
LTC/USDT Long-Term Trend — Bearish (Daily Chart)
Key Price Levels
Resistance: $80, $85, $90
Support: $75, $70, $65
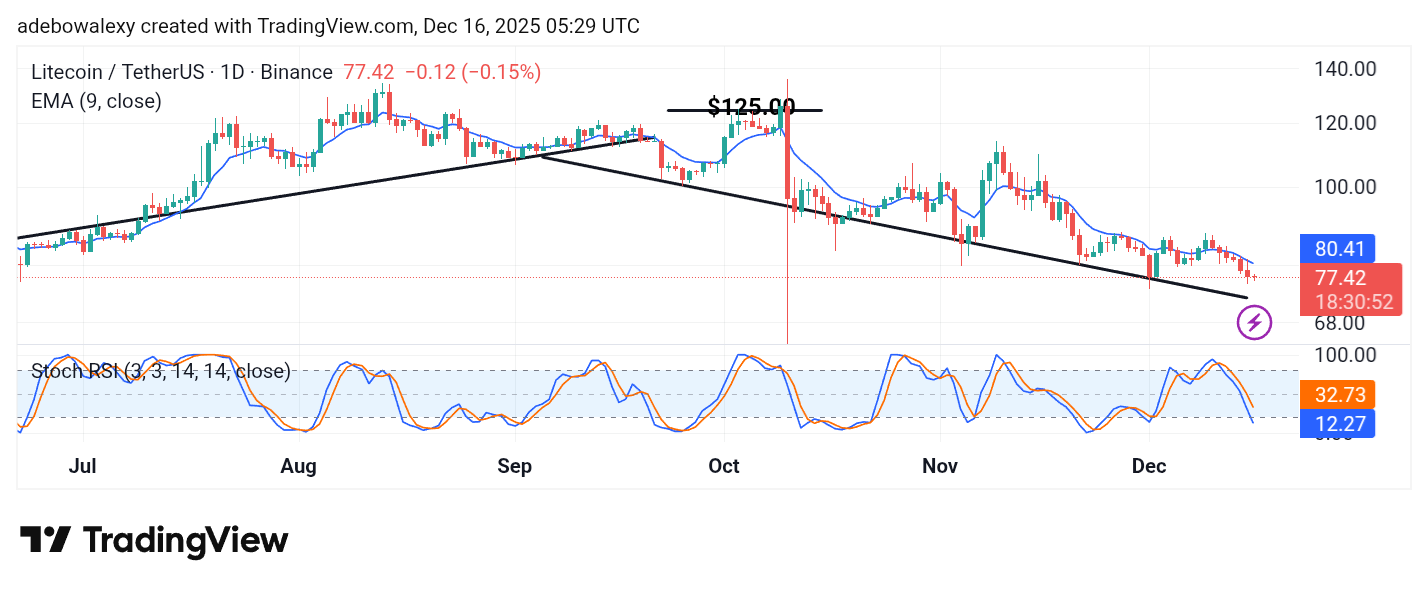
The Litecoin market has kept descending downward even through the ongoing session. Price candles on the coin’s daily chart have presented that for the past six sessions, price action has been bearish. The corresponding price candle on the chart stays red and positions the market below the 9-day Exponential Moving Average (EMA) line. Similarly, the Stochastic Relative Strength Index (SRSI) indicator lines are also descending straight into the oversold region of the indicator undeflected.
Litecoin (LTC) Price Prediction: LTC/USDT Bears Are on a Winning Streak
From six sessions ago till now, the LTC/USDT market has stayed on a downward course. The last price candle has presented little progress to the downward course and keeps the market going south and below the 9-day EMA curve.
The movement of the SRSI indicator lines suggests that bears have been cruising smoothly in this market, seeing that the lines of the indicator are not deflected in any way. However, one thing seems evident, and that’s the fact that the lines of the SRSI seem to be moving faster than price activity. This signals a possible support nearby.
Litecoin (LTC) Price Prediction: LTC/USDT Tries to Stay Above the $75 Mark (4-Hour Chart)
The Litecoin market on a 4-hour price chart has it that price action has seen a minimal upward retracement. Albeit, the ongoing session suggests that downside forces have started reclaiming control of the market.
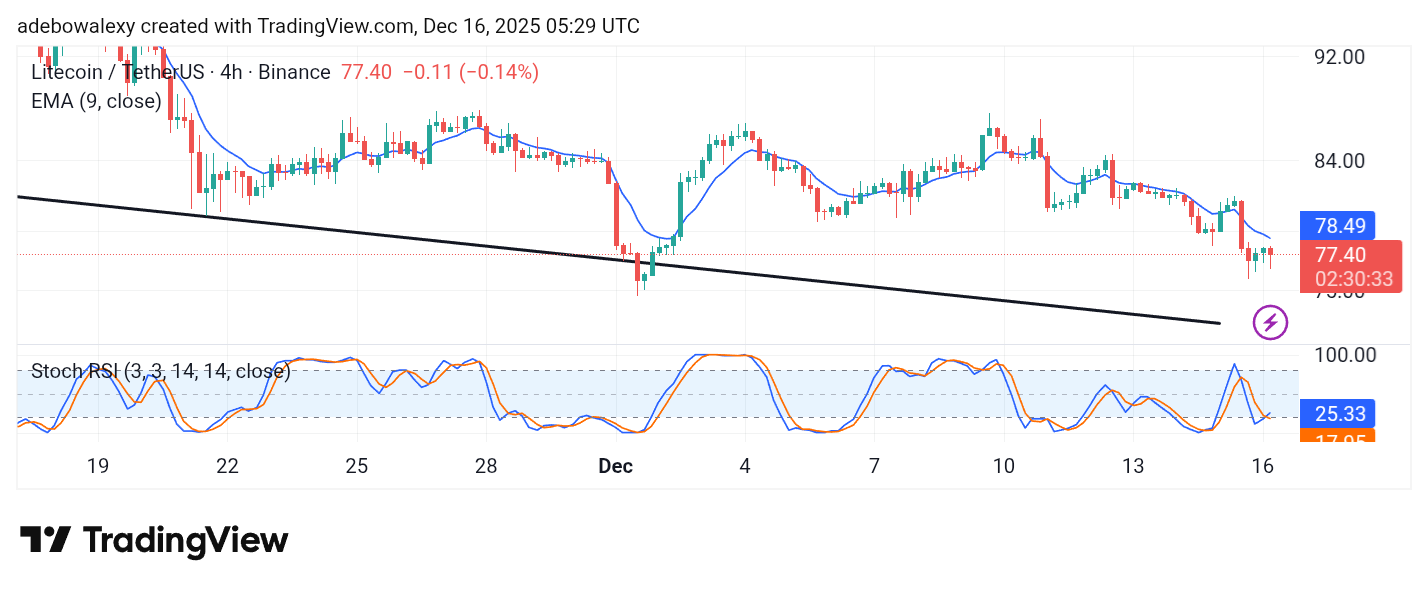
The last price candle has appeared red below the 9-day EMA curve and suggests that the market may resume its downward course. On the contrary, the SRSI indicator lines have delivered an upward move in the oversold region of the indicator.
Nevertheless, given the appearance of the last price candle on the chart, it seems that not much of an upward retracement may result from this market, as prices may descend towards the $75 mark.