Lucky Block Price Prediction: LBLOCK/USD Turns Lower for More Buyers to Surface
Estimated Reading Time: 3 minutes
Don’t invest unless you’re prepared to lose all the money you invest. This is a high-risk investment and you are unlikely to be protected if something goes wrong. Take 2 minutes to learn more

Free Crypto Signals Channel
The Lucky Block price prediction would begin to form higher as the coin prepares to follow the bullish movement.
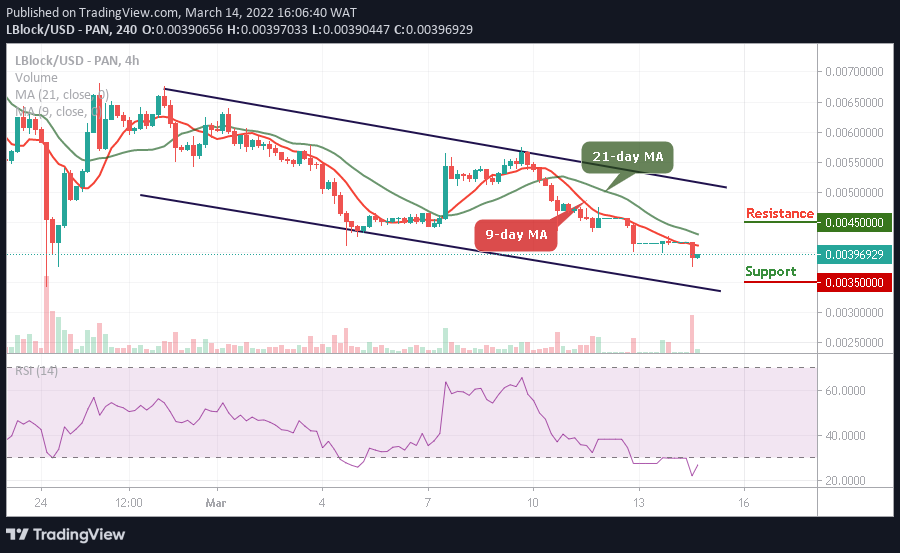
LBLOCK/USD Medium-term Trend: Bearish (4H Chart)
Key Levels:
Resistance levels: $0.0045, $0.0040, $0.0035
Support levels: $0.0035, $0.0030, $0.0025
LBLOCK/USD is at the time of writing trading below the 9-day and 21-day moving averages. The bulls are pushing the coin towards the resistance level of $0.0040 to gain access to the upside. However, the Lucky Block price may retreat a little but it is to allow more buyers to come into the market.
Lucky Block Price Prediction: LBLOCK/USD Would Spike to the Upside
The Lucky Block price would begin to rise and break above the 9-day and 21-day moving averages as soon as the bulls defend the $0.0040 support level. Meanwhile, any further bullish movement towards the upper boundary of the channel may push the coin to the potential resistance levels of $0.0045, $0.0040, and $0.0035.
In the meantime, this technical analysis may not play out now if the bears break below the lower boundary of the channel and fall to the support levels of $0.0035, $0.0030, and $0.0025. Moreover, the technical indicator Relative Strength Index (14) is moving within the oversold region to prepare the coin for the bullish movement in the next positive directions.
LBLOCK/USD Medium-term Trend: Bearish (2H Chart)
When compared to the 2-hour chart, the Lucky Block price would move up higher as it is ready to cross above the 9-day and 21-day moving averages. However, the long-term moving averages may keep the bullish movement as the market prepares for a new trend.
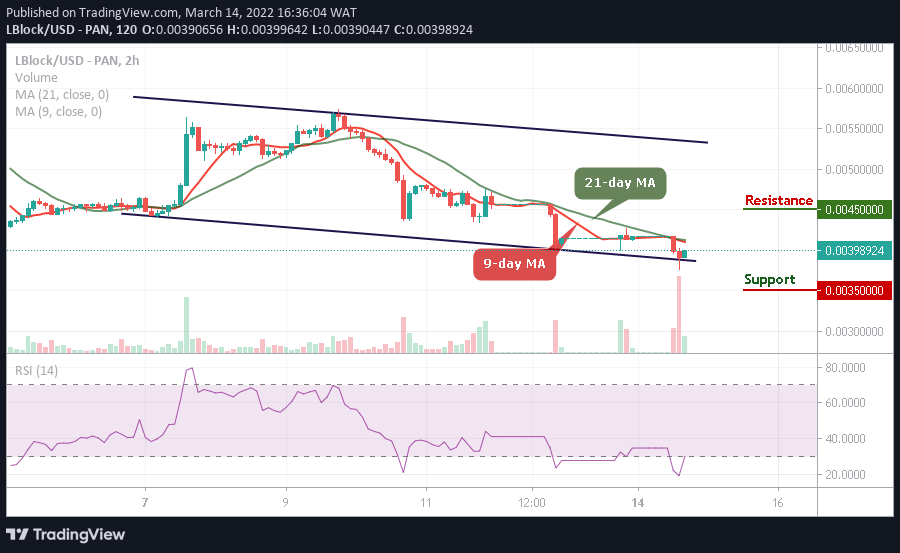
Nevertheless, if the buyers push the price above the moving averages, higher resistance could be reached at $0.0045 and above as the technical indicator Relative Strength Index (14) prepares to move away from the oversold region. Moreover, should the bulls fail to move the current market value above, the bears may step into the market, and the nearest support level could be located at $0.0035 and below.
Read more:


