Battle Infinity Market Forecast: IBAT Is in a Final Stage Before a Breakout
Estimated Reading Time: 3 minutes
Don’t invest unless you’re prepared to lose all the money you invest. This is a high-risk investment and you are unlikely to be protected if something goes wrong. Take 2 minutes to learn more

Free Crypto Signals Channel
Battle Infinity Market Forecast – September 7
Battle Infinity market forecast is for the price to break out as it approaches the final stages of its tapering movement. The coin is expected to break out to the upside of its triangle.
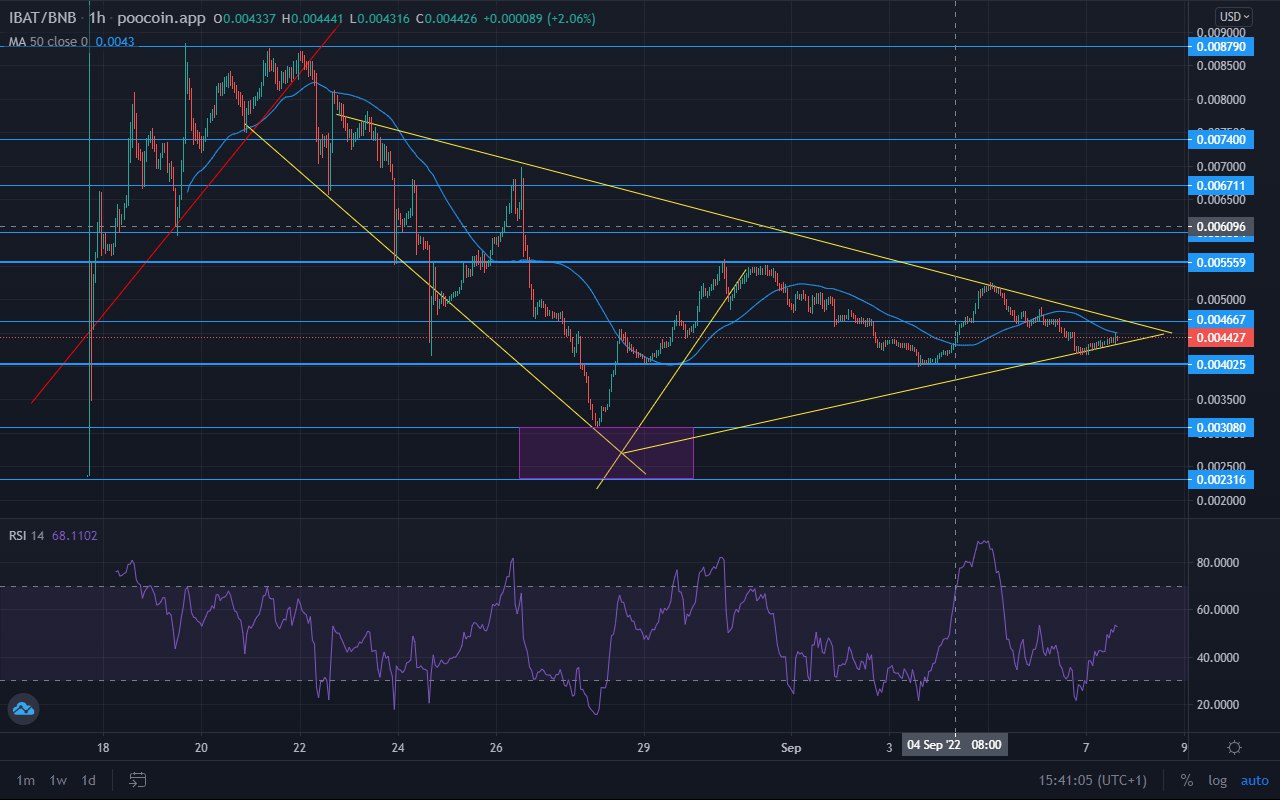
IBAT/USD Long-Term Trend: Bullish (1-Hour Chart)
Key Levels:
Supply Zones: $0.555900, $0.087900
Demand Zones: $0.0040250, $0.0030800
Battle Infinity is set to break out to the upside of its triangle pattern very soon. The system is in its final stage. An upward jerk is now needed to set the price in motion. Once the market is set in motion, it shouldn’t be an issue for the buyers to violate the entities that constitute resistance to the upward flow of the price.
Battle Infinity Market Forecast: IBAT Is Strongly Bullish
The upper limit of the triangle pattern flows down from the $0.0074000 supply level, while the lower limit of the triangle rises from the $0.0030800 demand level.
The price has been tapering continuously to a central point just below the $0.0046670 price level. The triangle structure is now in its final stage before the anticipated breakout to the upside.
The RSI (Relative Strength Index) indicator has its line rising from an oversold level. A trigger could see a sudden surge of volatility to help the price breakout, after which the RSI lines will push into the oversold region.
IBAT/USD Medium-Term Trend: Bullish (15-minute chart)
While on the 1-hour chart, the MA period 50 (Moving Average) is above the candles and acting as an extra layer of resistance (alongside the $0.0046670) to the upward flow of the market. On the 15-minute chart, the MA period 50 has dropped below the 15-minute candlesticks to act as support to push it above other resistances.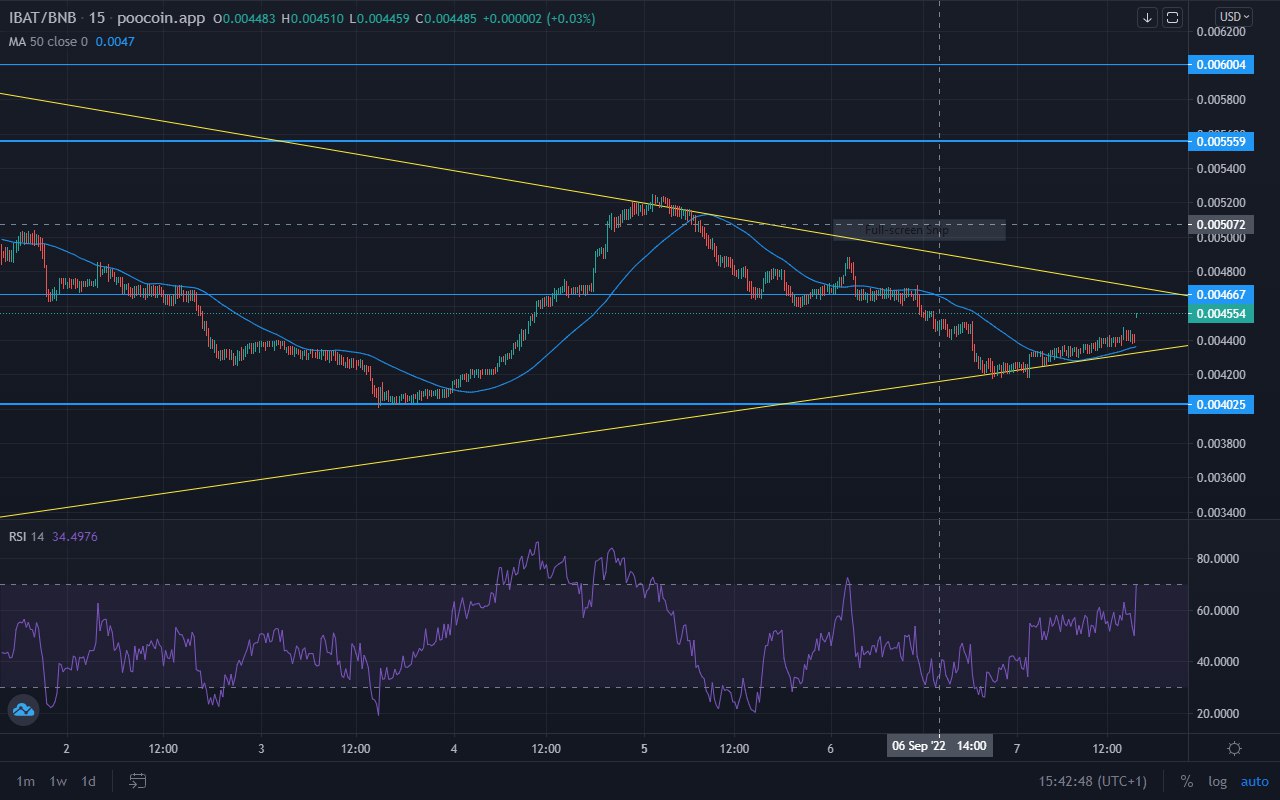
The RSI line has moved closer to the border of the oversold region on the 15-minute chart as the market enters the final phase of the bullish breakout system. Battle Infinity is expected to break the barriers to rise to $0.0055590, after which it will embark on another stretch that will see it attempt to reach $0.0087900.
Battle Infinity has huge potential for unusually massive returns. Buy IBAT
Note: Cryptosignals.org is not a financial advisor. Do your research before investing your funds in any financial asset or presented product or event. We are not responsible for your investing results.