Litecoin (LTC) Price Prediction: LTC/USDT Stays Under Pressure
Estimated Reading Time: 2 minutes
Don’t invest unless you’re prepared to lose all the money you invest. This is a high-risk investment and you are unlikely to be protected if something goes wrong. Take 2 minutes to learn more

Date: December 9, 2025
Although price movement in the Litecoin daily chart can be seen to have recovered a bit upward, it can still be largely considered that the market may remain under heavy downward pressure. This impression comes from how far the market has fallen and from signs shown by technical indicators.
LTC/USDT Long-Term Trend — Bearish (Daily Chart)
Key Price Levels
Resistance: $85, $90, $95
Support: $80, $70, $65
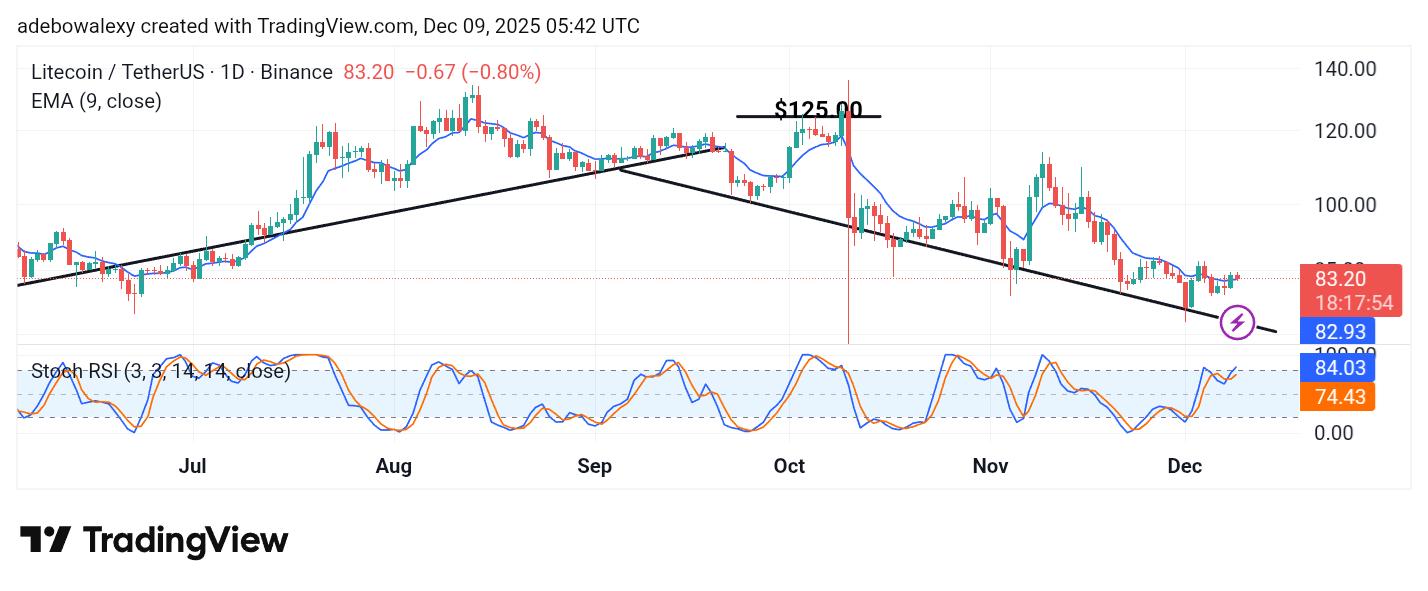
The last price candle on this Litecoin chart is a red one; however, it sits directly above the 9-day Exponential Moving Average (EMA) line. Meanwhile, the lines of the applied Stochastic Relative Strength Index (SRSI) indicator have delivered an upward crossover just below the 80 level. The resulting lines of the indicator can be seen rising steadily upward into the overbought region despite the bearish appearance of the last daily candle.
Litecoin (LTC) Price Prediction: LTC/USDT at a Crossroad
Today’s trading session in the Litecoin daily market has arrived at a crossroads. As such, one may ask if the short-term upward recovery will continue or yield to bearish pressure. The last price candle on the chart sits directly on the 9-day EMA while appearing red.
Although the SRSI indicator lines are still projected upward, largely due to the previous upside movement in the market. However, the lead line of the indicator pokes through the 80 mark while the lagging line follows behind. This signals that upside forces may still find a way to proceed higher.
Litecoin (LTC) Price Prediction: LTC/USDT Stays Afloat Above the $80 Baseline (4-Hour Chart)
Even on a 4-hour price chart, one can see that price activity remains above the 9-day EMA curve. This is so even though the last two price candles on the chart are red and have descended toward the 9-day EMA curve.
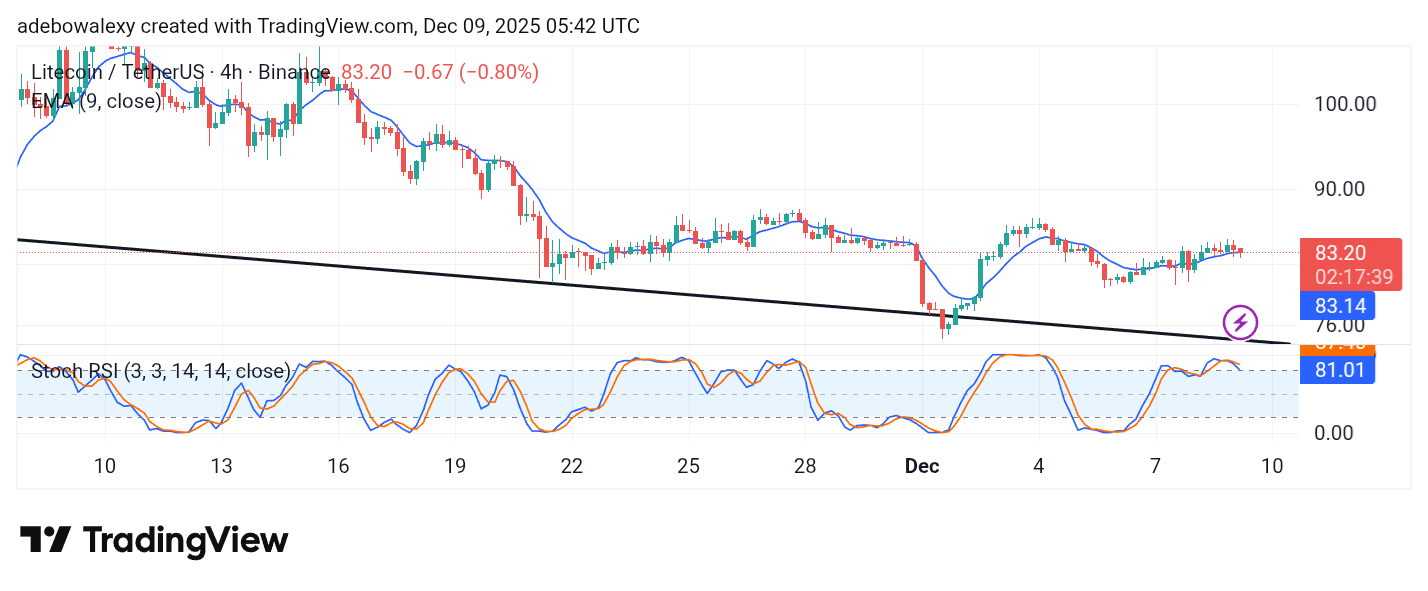
Likewise, the lines of the SRSI indicator have descended to the 80 mark following a downward crossover in the overbought zone. Should price action descend below the 9-day EMA curve here, the market may take on a short-term trajectory toward the $80 mark.