Bitcoin (BTC/USD) Price Keeps Retracement Close to $55,000
Estimated Reading Time: 3 minutes
Don’t invest unless you’re prepared to lose all the money you invest. This is a high-risk investment and you are unlikely to be protected if something goes wrong. Take 2 minutes to learn more
Bitcoin Price Prediction – November 24
The downward movement in the BTC/USD market has led the crypto-economic price to keep retracement close to the $55,000 trading line. The rate of percentage of the crypto trade down turning observed at about 1.88 negatives, trading around $56,596 as of writing.
BTC/USD Market
Key Levels:
Resistance levels: $60,000, $625000, $65,000
Support levels: $52,500, $50,000, $47,500
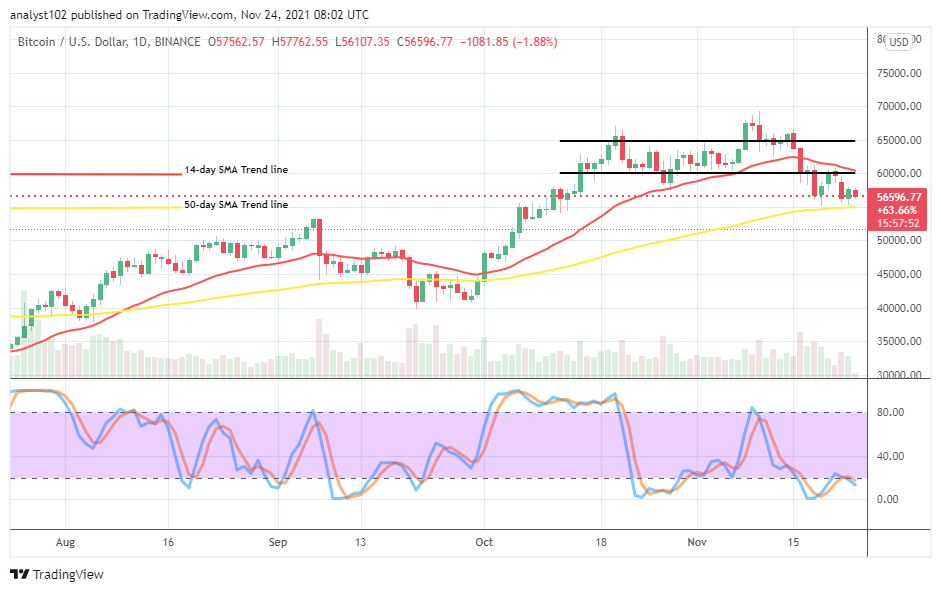
BTC/USD – Daily Chart
The BTC/USD daily chart showcases that the crypto-economic price keeps retracement close to $55,000. The crypto market loses momentum between $65,000 and $70,000 lately this month. The 50-day SMA trend line is underneath the 14-day SMA trend line, affirming a firm support spot at the value line mentioned earlier. The Stochastic Oscillators have formerly moved northbound from the range of zero in the oversold region. But, they’ve crossed the lines at range 20, slightly southbound, to indicate that the downward correction has somewhat not yet over.
Will the $55,000 level serve as a technical instrument to determine subsequent directions as the BTC/USD price keeps retracement close to it?
There have been some positive thoughts about the BTC/USD market operations will regain its lost momentums soon as the crypto-economic price keeps retracement close to $55,000 support trading zone presently. It would require a lot of effort that long position takers of this trading pair instrument stay alerted when active rebounding motion tends to feature back in action from a lower trading axis around the support value-line before launching a buy order.
On the continuation of the current downward correction technical analysis as against the upside, the BTC/USD market short position takers tend to consolidate their stances to extend the pushes briefly past the trend line of the 50-day SMA at $55,000 to a lower support level of $52,500 in the long run. Traders, intending to go bearish further at those points needed to be cautious of their entries to avoid unnecessary whipsawed trading conditions in no time.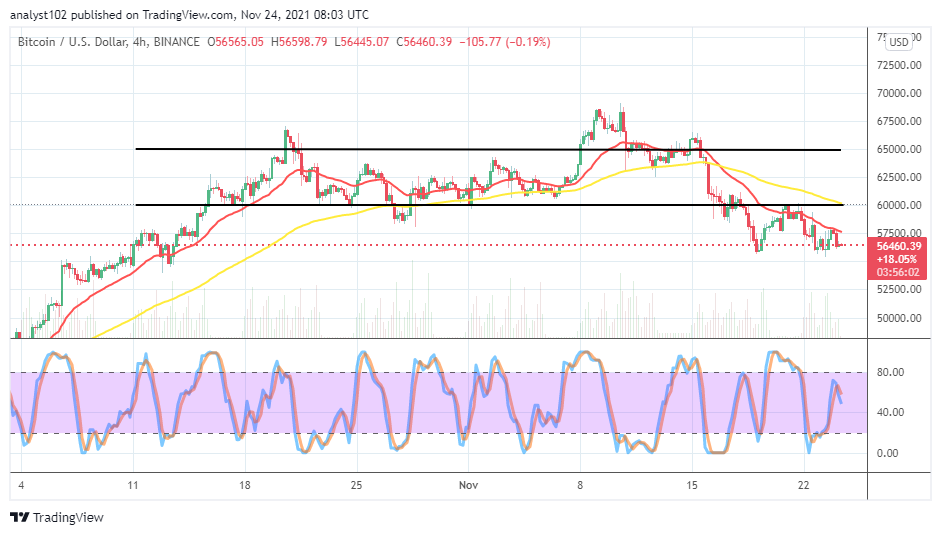
BTC/USD 4-hour Charts
The BTC/USD medium-term chart reveals that the crypto-economic price keeps retracement close to $55,000. The 14-day SMA trend line is situated at $57,500 underneath the 50-day SMA trend line, indicating a barrier resistance trading spot at the level. The Stochastic Oscillators have crossed the lines southbound above the range of 40. That suggests that some amounts of downs are still playing on as points between $55,000 and $52,500 remain the critical support trading zones for a sudden re-emergence downward fearful motion afterward.
Note: Cryptosignals.org is not a financial advisor. Do your research before investing your funds in any financial asset or presented product or event. We are not responsible for your investing results.
You can purchase crypto coins here. Buy Tokens