Solana (SOL) Price Prediction: SOL/USDT Trend Reverses, Trades Above the $140 Mark
Estimated Reading Time: 2 minutes
Don’t invest unless you’re prepared to lose all the money you invest. This is a high-risk investment and you are unlikely to be protected if something goes wrong. Take 2 minutes to learn more

Date: January 9, 2026
Following a prolonged period of downward correction in the Solana market, upside forces are now regaining control. This shift has helped price action climb back above key technical indicators as well as important price levels.
Long-Term Trend — Bullish (Daily Chart)
Key Price Levels
Resistance: $145, $150, $155
Support: $140, $135, $130
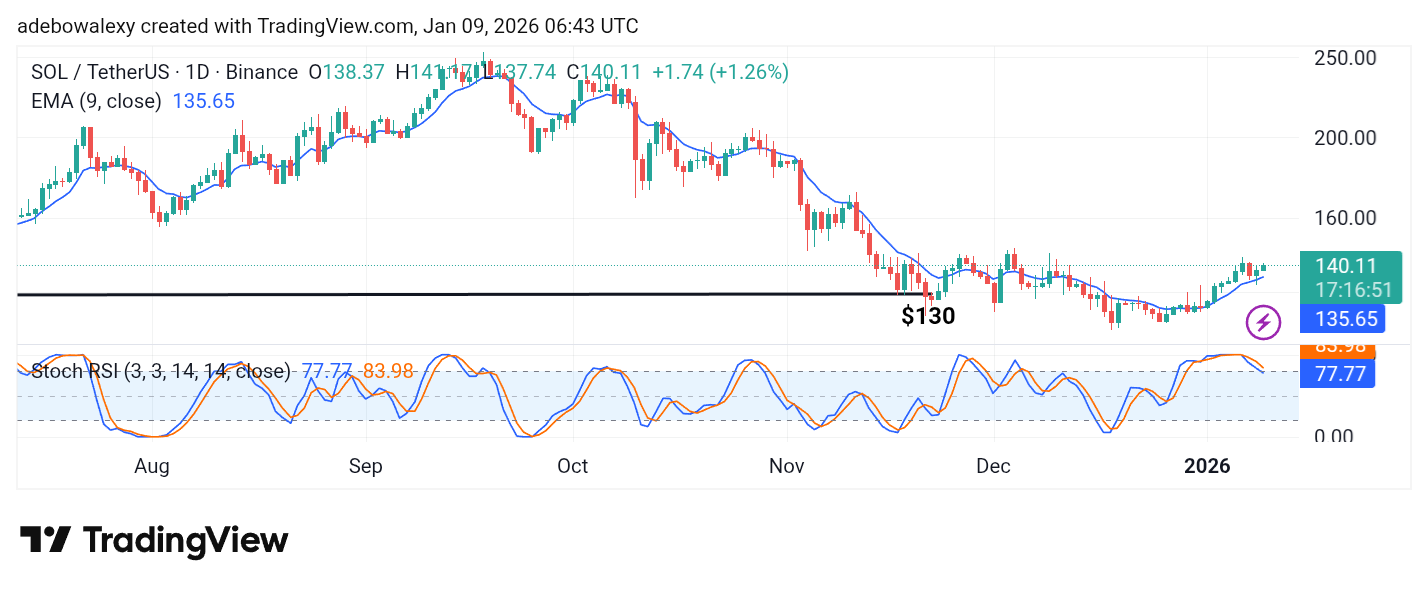
Price action on the Solana daily chart moved above the 9-day Exponential Moving Average (EMA) nine sessions ago and has continued to trade above this technical benchmark since then. The current session is represented by a green price candle.
Meanwhile, the Stochastic Relative Strength Index (SRSI) lines on the daily chart remain above the 80 level, although they are sloping downward due to the price pullback seen over the past two sessions.
Solana (SOL) Price Prediction: Buyers Remain Active
Since price action broke above the 9-day EMA curve on the daily chart, the Solana market has maintained an upward trajectory. Although there was a brief dip during the past two sessions, buyers quickly reasserted control, pushing the market back onto an upward path.
The SRSI indicator continues to reflect the recent dip; however, its position within the overbought region still provides a positive outlook for the market.
Solana (SOL) Price Prediction: SOL/USDT Stays Positive but Registers a Mild Rejection (4-Hour Chart)
The ongoing session on the Solana 4-hour chart is marked by a small red candle, indicating a mild rejection. However, the previous session exerted a stronger influence on the overall trend, keeping price action at a notable distance above the 9-day EMA curve.
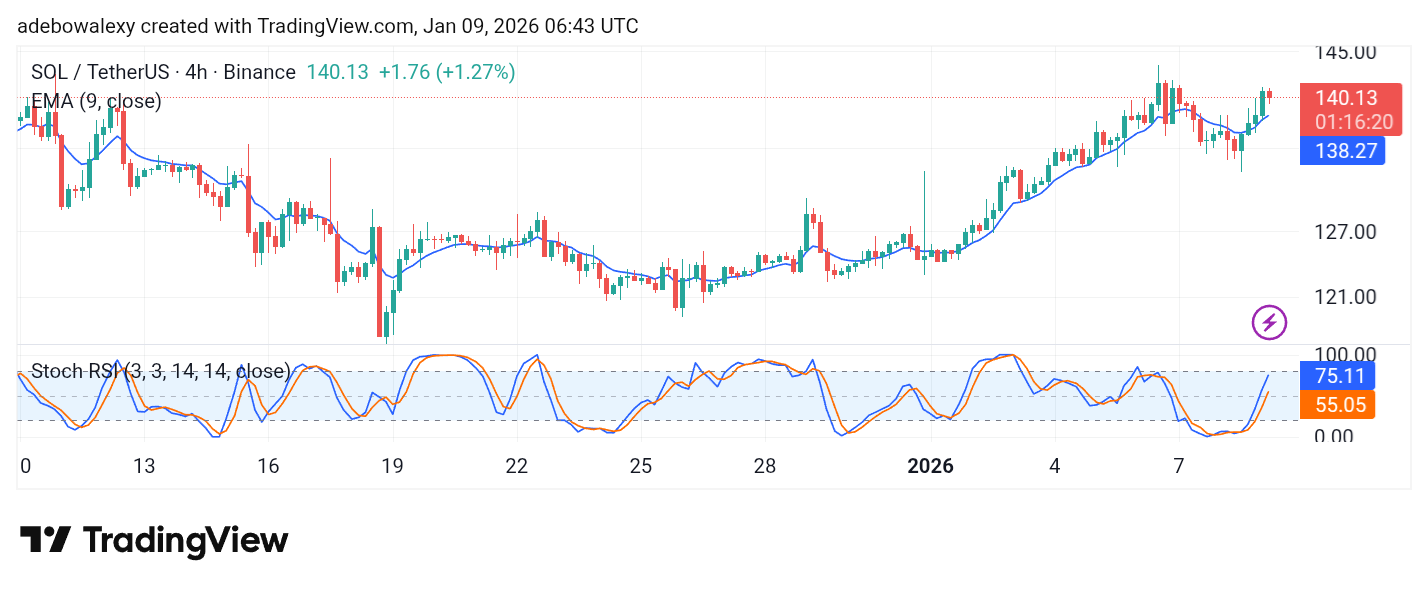
Additionally, the SRSI lines remain tilted upward within the overbought region, despite the minor pullback in the current session. As a result, traders may continue to target the $145 price level.