SPONGE/USD ($SPONGE) Finds Solid Ground at $0.0001158
Estimated Reading Time: 3 minutes
Don’t invest unless you’re prepared to lose all the money you invest. This is a high-risk investment and you are unlikely to be protected if something goes wrong. Take 2 minutes to learn more

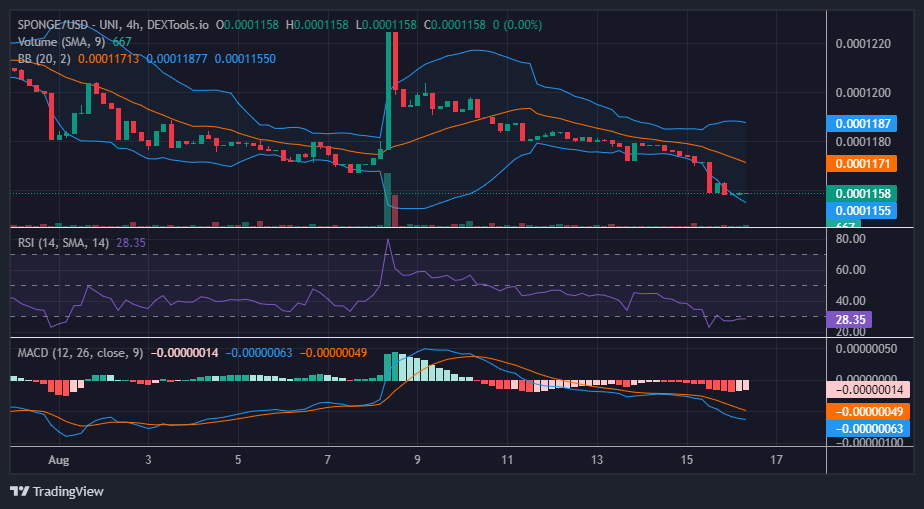
The $SPONGE market seems to have found firm support near the $0.0001158 price level. Yesterday’s bearish market experienced a surge in trading activity, pushing the price further into the demand zone until it reached approximately the $0.000116 price level. However, it’s important to note that at this point, the market established a new low that was even lower than the low of August 7th, which was at $0.0001167. Considering the significant price surge that originated from this level on the following day, a similar reaction could potentially be anticipated from the $0.0001158 price level as well.
Key Levels
- Resistance: $0.0004, $0.0045, and $0.0005.
- Support: $0.00011, $0.00010, and $0.00009.
Sponge (SPONGE/USD) Price Analysis: The Indicators’ Point of View
Based on the Relative Strength Index (RSI), the $SPONGE market is currently experiencing a slight range-bound movement just below the oversold threshold, specifically at the level of 28.35. The information from this indicator can add to the optimistic sentiment associated with this level. Nevertheless, the limited trading volume might impede the pace of recovery.
The market appears to be gearing up for a bullish trend, as indicated by the Moving Average Convergence and Divergence (MACD), which is also displaying indications of diminishing bearish momentum. The most recent two negative histograms have transitioned to faded red.
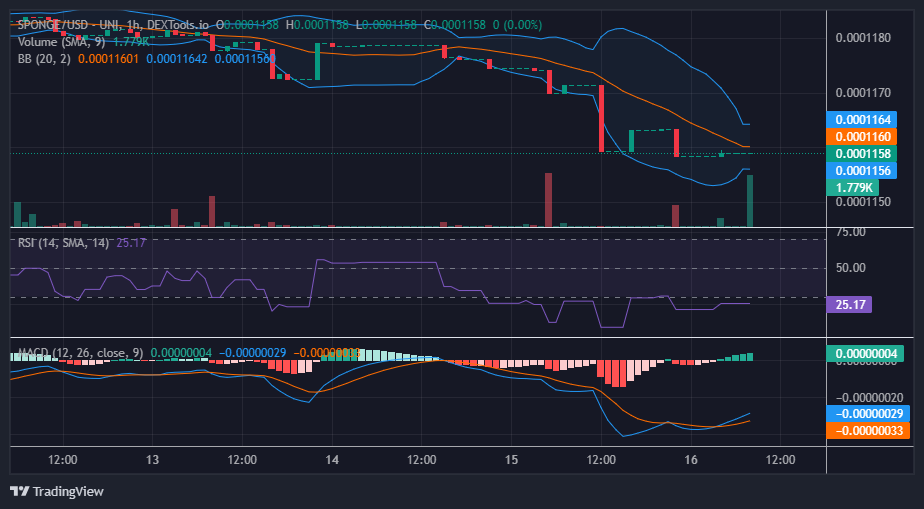
$SPONGE Short-Term Outlook: 1-Hour Chart
Analyzing the 1-hour chart perspective of the market around the $0.0001158 price level reveals a pronounced level of stagnation. The occurrence of four-price dojis persists at this horizontal price threshold. In the latest 1-hour trading session, the presence of the four-price doji was matched with a robust volume histogram. This could potentially signify substantial participation from traders who are actively engaged in this session. The elevated volume could potentially indicate a shift in sentiment, increasing the likelihood of a reversal scenario from its current direction.
Don’t pass up the fantastic $SPONGE Airdrop chance!
Greetings #SPONGERS!!!👋🧽
Don’t miss out on the incredible $SPONGE #Airdrop opportunity!🎁🚀
Hop into our #Discord community and follow the guidelines in the airdrop-signup section to take part!📋🔗
Snatch your well-deserved rewards today!💰💪
https://t.co/g4VEBoaXFj pic.twitter.com/tvHmektrpO— $SPONGE (@spongeoneth) August 16, 2023
Invest in the hottest and best meme coin. Buy Sponge ($SPONGE) today!