SPONGE/USD ($SPONGE) Ventures More Into the Demand Zone; Time to Buy the Dip
Estimated Reading Time: 3 minutes
Don’t invest unless you’re prepared to lose all the money you invest. This is a high-risk investment and you are unlikely to be protected if something goes wrong. Take 2 minutes to learn more

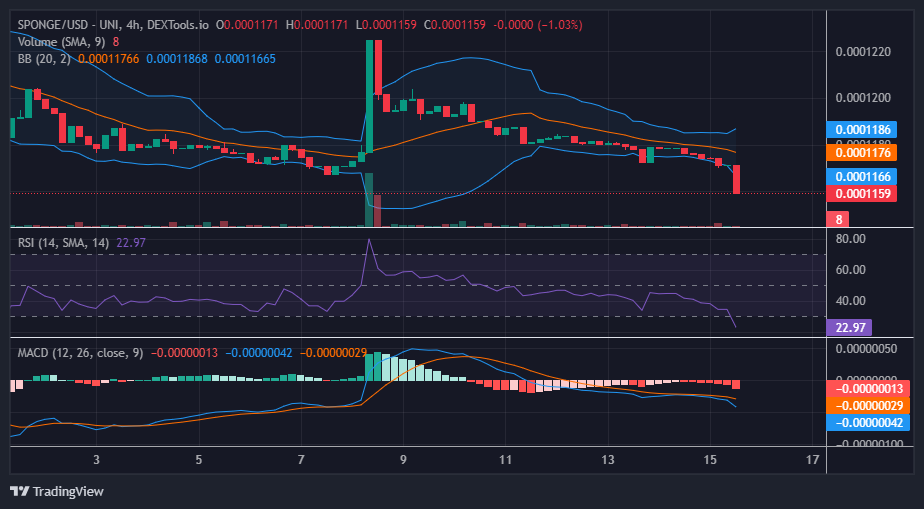
The SPONGE/USD trading pair experienced a mini-bullish price recovery, moving from $0.0001172 to $0.0001179. This suggests a modest uptrend in market sentiment. However, the price then encountered a strong resistance level, causing the market to become flat. This flat movement around the resistance level could signify indecision or uncertainty, and this contributed to the strong movement of the market in the bullish direction.
Towards the end of the previous daily trading session, the market’s flat movement gave way to downward momentum. This indicates that bearish sentiment started to gain strength, leading to a breakdown of price levels in the demand zone. This breakdown is likely indicative of increased selling pressure overcoming buying interest, resulting in a negative price movement.
Key Levels
- Resistance: $0.0004, $0.0045, and $0.0005.
- Support: $0.00011, $0.00010, and $0.00009.
Sponge (SPONGE/USD) Price Analysis: The Indicators’ Point of View
The most recent SPONGE/USD 4-hour trading session displayed a bearish marubozu candlestick. A bearish marubozu suggests that the bears controlled the entire trading session, pushing the price down from its opening level to the closing level without any significant retracement. This candlestick pattern reflects strong bearish sentiment and suggests that sellers are firmly in control.
The RSI, measuring at a level of 22.97, indicates that the market has moved into oversold territory. An RSI reading below 30 generally suggests that the asset might be oversold and that a potential price rebound or reversal could be on the horizon. The divergence of the Bollinger Bands indicates that volatility in the market has increased. When the Bollinger Bands expand, it suggests that the market is experiencing higher price fluctuations. The increased volatility could be advantageous for the bulls if a bullish recovery occurs. In periods of high volatility, price movements can be more pronounced, potentially leading to larger price swings in either direction.
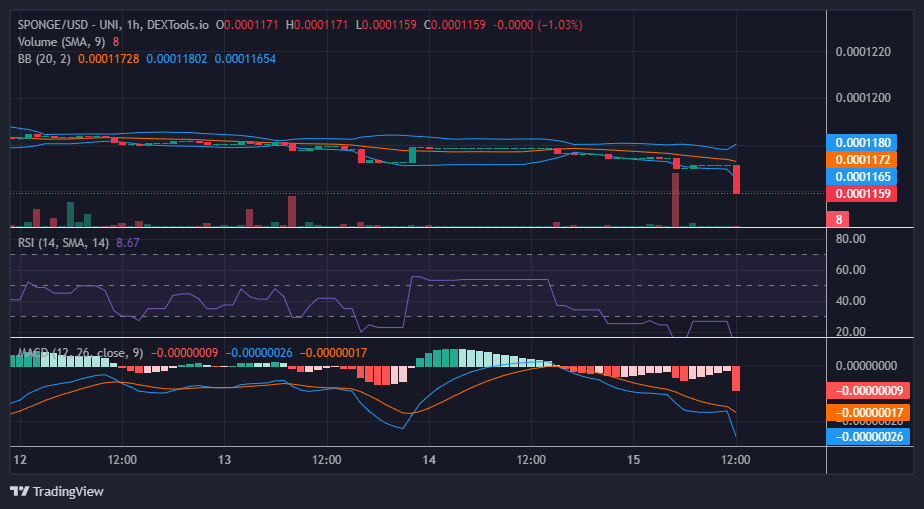
$SPONGE Short-Term Outlook: 1-Hour Chart
The initial flat movement at the resistance level followed by a strong breakdown, coupled with the bearish marubozu candlestick, suggests a prevailing bearish sentiment. However, the oversold RSI level and increased volatility indicated by the Bollinger Bands divergence could offer potential opportunities for a bullish recovery in the market.
You can start trading SPONGE/USD on the Poloniex platform.
Attention all #SPONGERS! 🧽🌊
Commence trading $SPONGE on #Poloniex now! 💰🚀
Don’t wait, soak all the damp today! 🌊🌟
https://t.co/1Fq3Nsz7do pic.twitter.com/3jdtdiWyI2— $SPONGE (@spongeoneth) August 14, 2023
Invest in the hottest and best meme coin. Buy Sponge ($SPONGE) today!