Bitcoin Price Prediction: BTC/USD Prepares for Another Spike Above $42k
Estimated Reading Time: 3 minutes
Don’t invest unless you’re prepared to lose all the money you invest. This is a high-risk investment and you are unlikely to be protected if something goes wrong. Take 2 minutes to learn more
The Bitcoin price prediction shows that BTC is trading at $42,075 as the coin seems to be preparing for another upward movement.
Bitcoin Price Prediction – January 29
BTC/USD Long-term Trend: Ranging (Daily Chart)
Key levels:
Resistance Levels: $48,000, $50,000, $52,000
Support Levels: $36,000, $34,000, $32,000
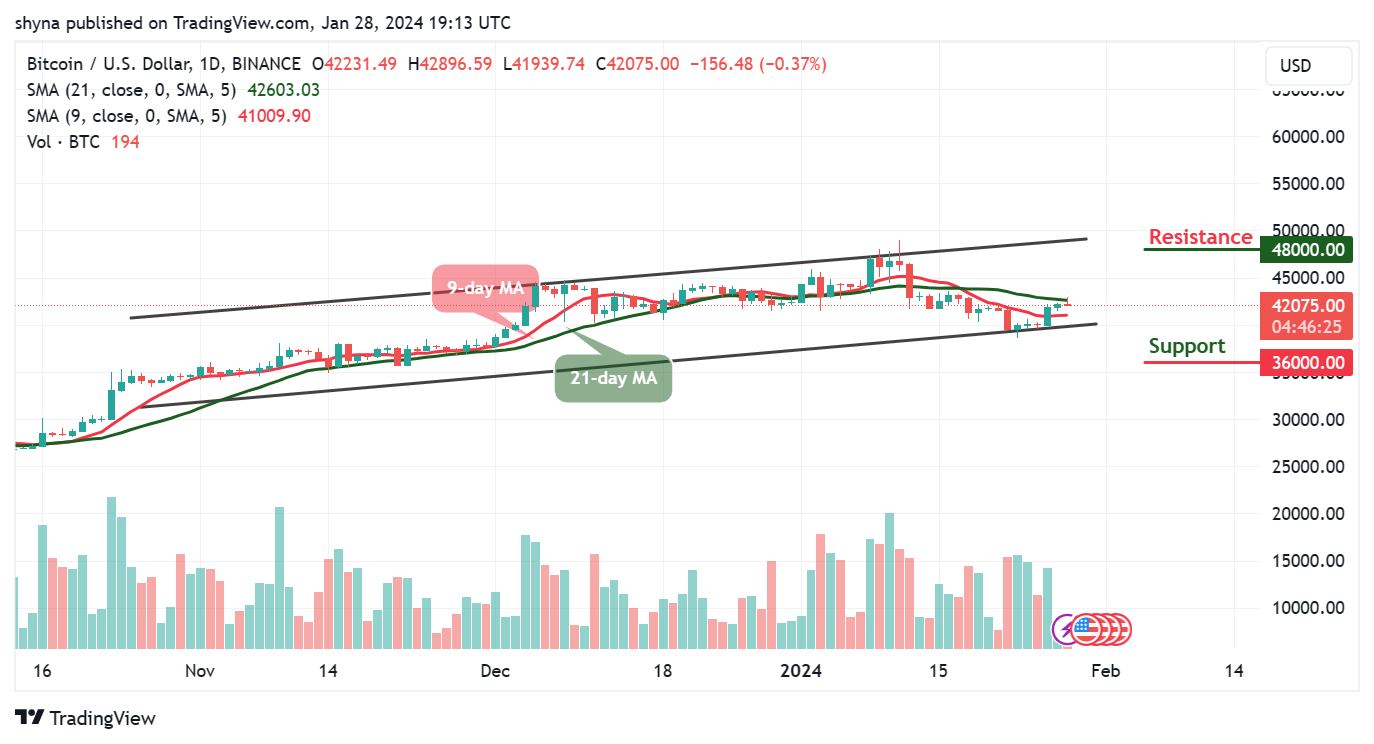
BTC/USD is attempting a fresh increase above the 21-day moving average as the king coin trades at $42,075. At the time of writing, the Bitcoin price could gain bullish momentum if there is a clear move above the $43,000 resistance. However, the first digital asset could rise further if there is a strong bullish movement toward the upper boundary of the channel.
Bitcoin Price Prediction: BTC/USD Ready for A Cross Above $45k
The Bitcoin price is hovering within the 9-day and 21-day moving averages, any further bullish movement could locate the potential resistance levels at $48,000, $50,000, and $52,000. Nevertheless, if BTC/USD soars toward the upper boundary of the channel, it could be a sign of sustainability and could result in a bullish continuation.
Additionally, if the Bitcoin price fails to move up; traders may see a price cut toward the lower boundary of the channel, and a further low could bring the price to the support levels at $36,000, $34,000, and $32,000 respectively. But as it stands, the Bitcoin price is likely to rise if the 9-day moving average crosses above the 21-day moving average.
BTC/USD Medium-term Trend: Ranging (4H Chart)
According to the 4-hour chart, the Bitcoin price is following a sideways movement as the coin moves to cross above the 9-day moving average. However, this could mean that bulls are coming back into the market to push the king coin above the upper boundary of the channel. If not, the support level of $39,000 and below may come into play.
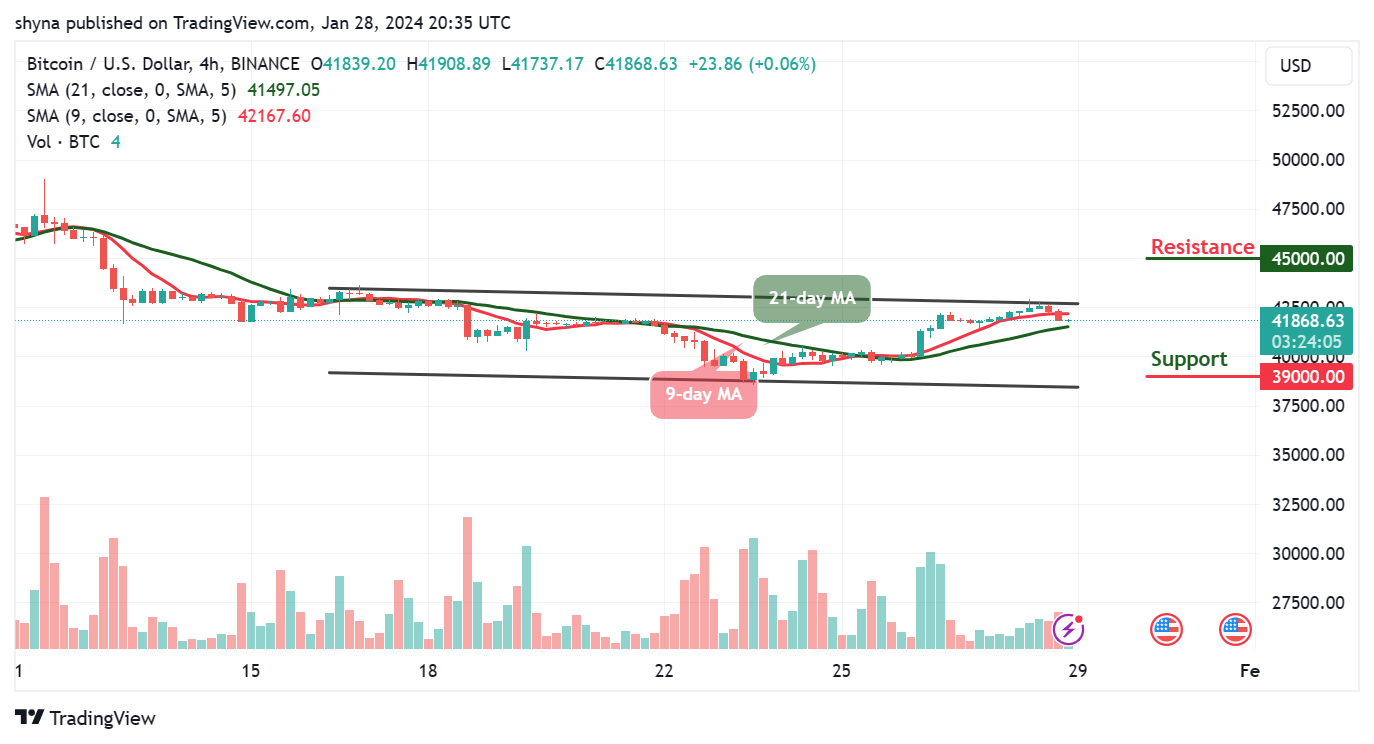
However, if the bulls push the market above the channel, traders may expect a retest of the $44,000 resistance level, and breaking this level could hit the resistance level of $45,000 and above. Meanwhile, the 9-day MA continues to hover above the 9-day MA, suggesting a bullish signal.
You can purchase Bitcoin here. Buy BTC