Solana (SOL) Price Prediction: SOL/USDT Stays Under Bearish Pressure
Estimated Reading Time: 2 minutes
Don’t invest unless you’re prepared to lose all the money you invest. This is a high-risk investment and you are unlikely to be protected if something goes wrong. Take 2 minutes to learn more
Solana (SOL) Price Prediction: September 6
Solana’s price action has maintained a steady bearish path, with the token approaching lower support levels. At this point, it seems price action may soon fall through the $130.00 baseline, despite the reduction in price volatility.
SOL/USDT Long-term Trend: Bullish (Daily Chart)
Key Price Levels:
Resistance: $140, $150, $160
Support: $120, $110, $100
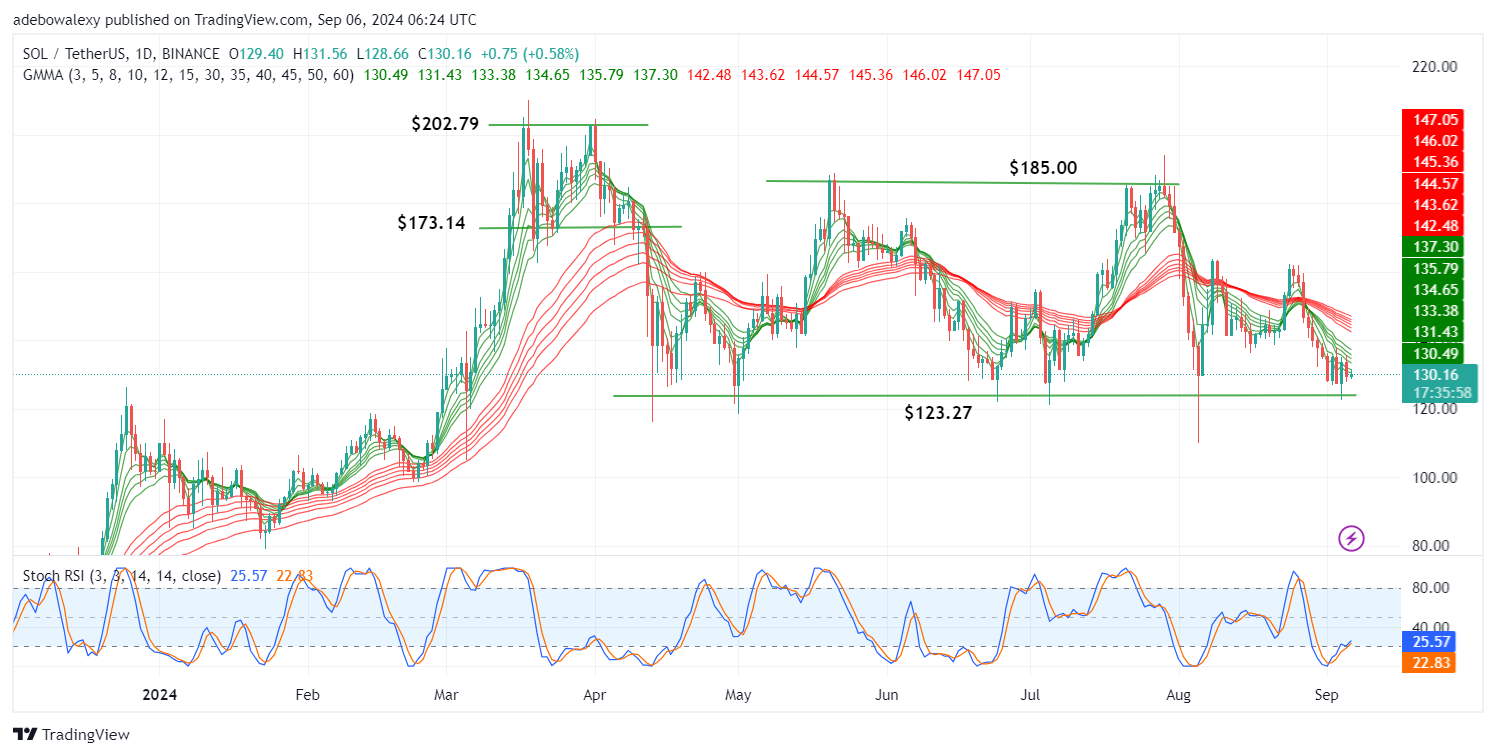
The last price candle on the SOL/USDT daily price chart is green. However, it appeared after price action retraced sharply downward in a single session. Also, its size and location below all the Guppy Multiple Moving Average (GMMA) curves seem unfavorable. The Stochastic Relative Strength Index (Stochastic RSI) lines have continued upwards in the oversold region after aborting a bearish crossover.
Solana (SOL) Price Prediction: SOL/USDT Market May Still Head Towards $123 Baseline
Signs from technical indicators on the Solana daily price chart still suggest that price activity is burdened. The last price candle has appeared below all the GMMA, signaling that upside attempts may be quickly muscled down.
Additionally, the Stochastic RSI remains in the depths of the oversold region. Its lines are trending upwards but appear fragile, given how close they are to each other. Also, volatility is quite low in this market, which hints that bears may easily regain control toward the $123.00 threshold.
Solana (SOL) Price Prediction: SOL/USDT Bears Start a Continuation (4-Hour Chart)
Looking at the SOL/USDT 4-hour price chart, the last price candle has appeared red, bringing the market back below all the GMMA indicator lines. Despite this, the Stochastic RSI lines are still projected upwards, crossing the 50 threshold of the indicator.
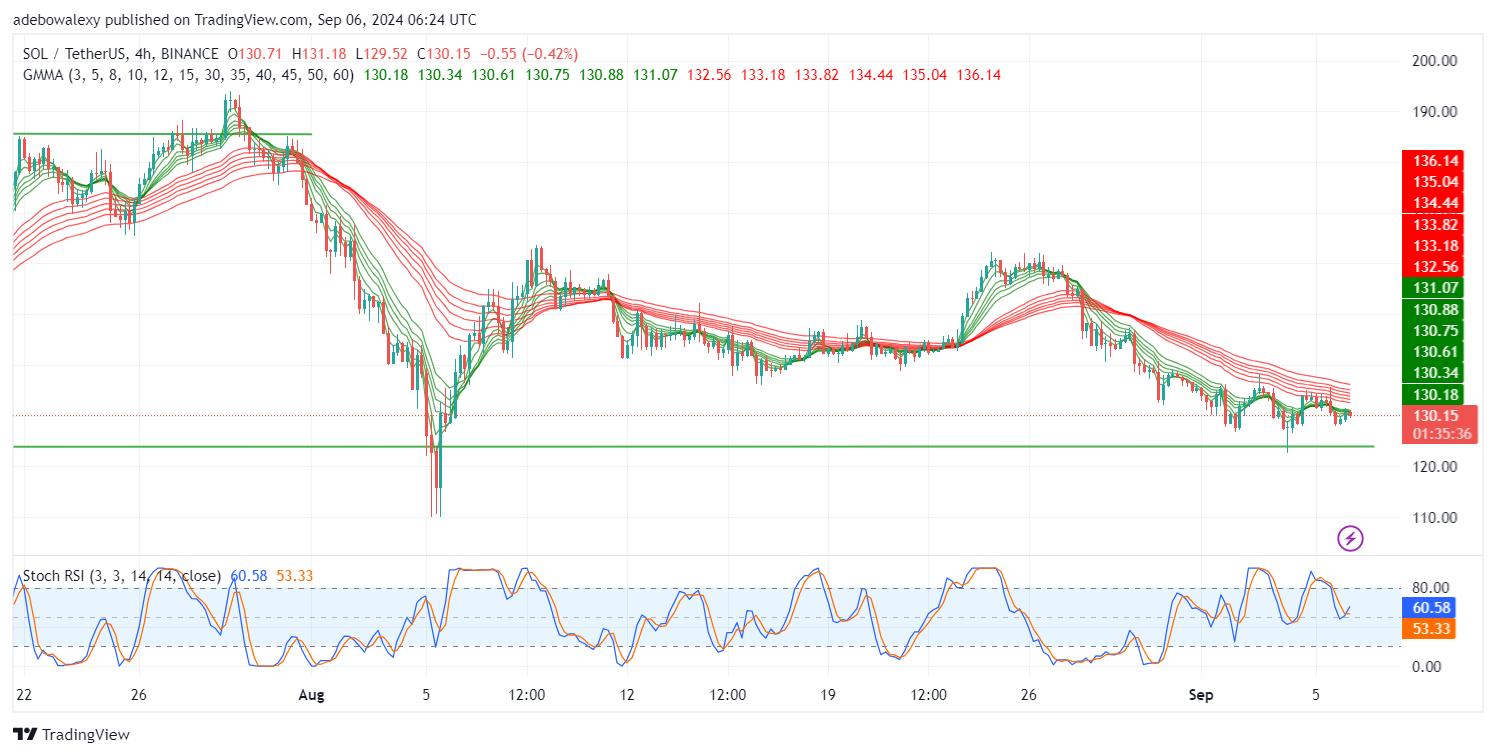
Here, technical indications seem contradictory. The GMMA lines and price movement suggest a continuation of downward retracement. However, the activity on the Stochastic RSI lines indicates that upside momentum is gaining strength. At this juncture, it seems safer to stay with the trend toward the $123.00 threshold.