Hedera Hashgraph (HBAR/USD) Extends Its Bullish Recovery
Estimated Reading Time: 3 minutes
Don’t invest unless you’re prepared to lose all the money you invest. This is a high-risk investment and you are unlikely to be protected if something goes wrong. Take 2 minutes to learn more

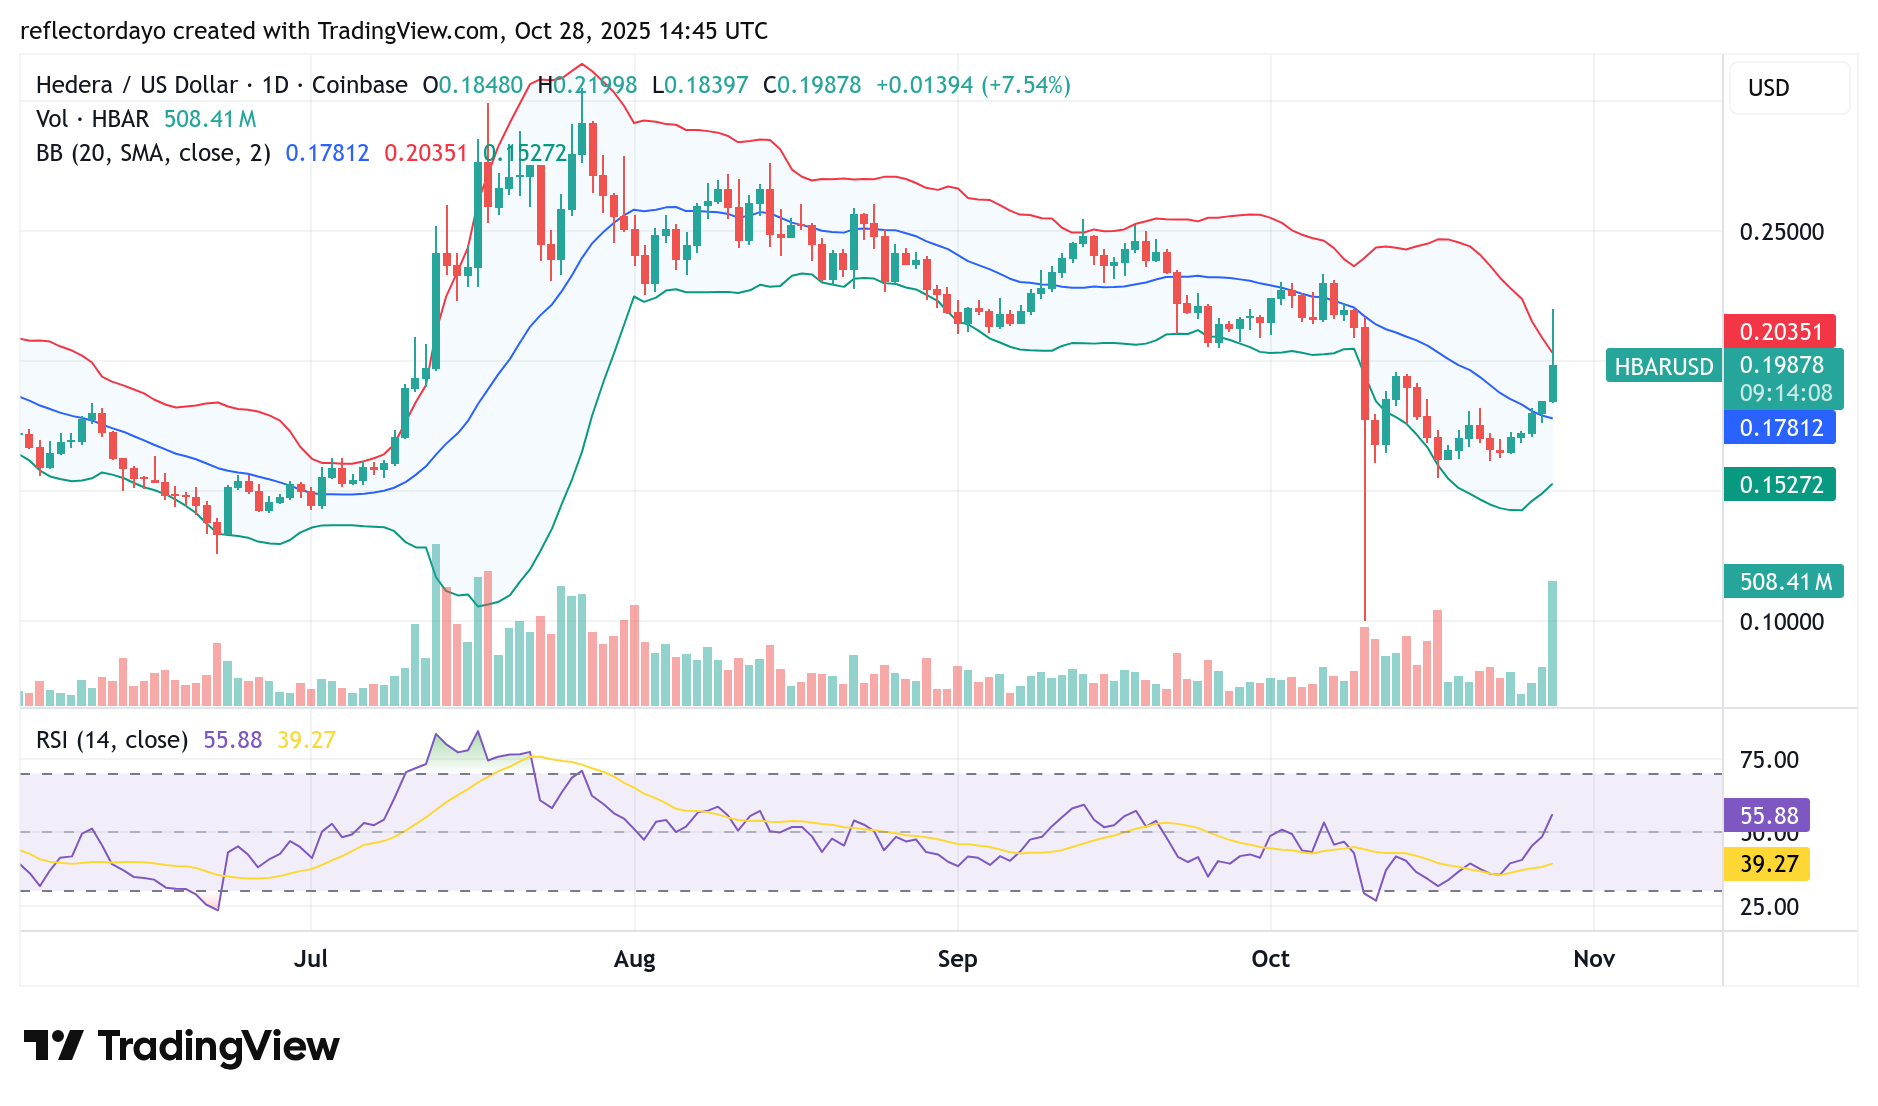
Following a prolonged bearish phase that began in July from highs above the $0.30 level, the Hedera Hashgraph (HBAR/USD) market entered a brief consolidation period. The downtrend was gradual yet persistent, with bearish momentum dominating until October 10, when the market broke decisively below the $0.20 support level.
This sharp decline in the crypto signal triggered significant buying activity around the $0.10 zone, where traders began accumulating positions. The strong buying pressure fueled a swift rebound, allowing the market to recover and stabilize near the $0.165 level, signaling the continuation of a bullish recovery phase.
Hedera Hashgraph (HBAR/USD) Market Data
- HBAR/USD Price Now: $0.20
- HBAR/USD Market Cap: $8.6 billion
- HBAR/USD Circulating Supply: 42.5 billion HBAR
- HBAR/USD Total Supply: 50 billion HBAR
- HBAR/USD CoinMarketCap Ranking: #18
Key Levels to Watch
- Resistance: $0.22, $0.25, $0.27
- Support: $0.16, $0.14, $0.12
Hedera Hashgraph (HBAR/USD) Daily Chart Outlook
Following the market’s drop to the $0.10 price level on October 10, Hedera Hashgraph (HBAR/USD) became increasingly attractive to investors, reigniting bullish sentiment across the market. However, despite the renewed buying interest, the market remained within bearish territory until the crucial resistance at $0.195 was breached — a move that has now occurred in today’s trading session.
With this breakout, bullish momentum has gained significant control. The market rallied toward the $0.22 level, peaking there before a corrective pullback brought the price to stabilize around the $0.20 mark. When comparing today’s candlestick to the volume histogram, it is evident that the histogram remains relatively larger, suggesting lingering bearish sentiment attempting to counter bullish advances. Nonetheless, at this stage, the bulls maintain the upper hand and appear poised to sustain their dominance in the near term.
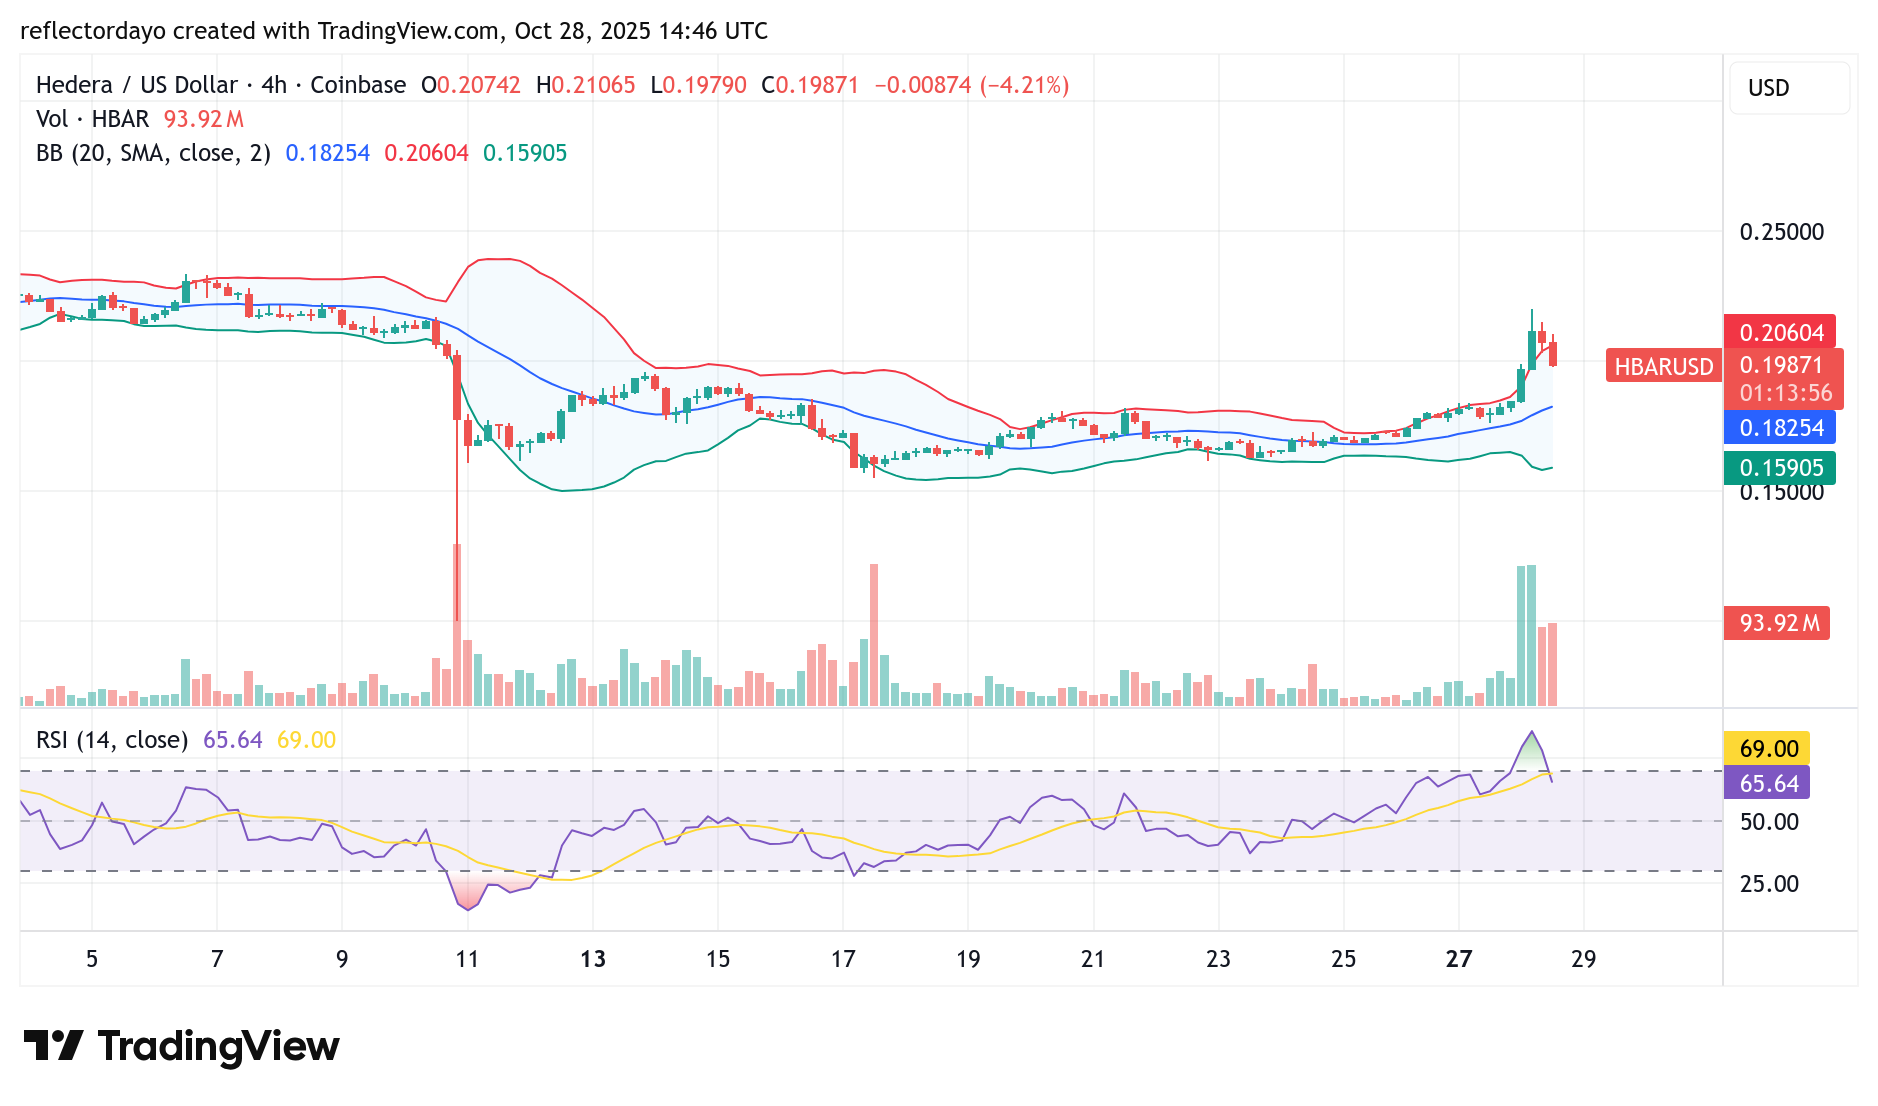
HBAR/USD 4-Hour Chart Outlook
From the 4-hour chart perspective, a new higher support level appears to be forming around the $0.20 threshold. The presence of a lower shadow beneath the current bearish candlestick suggests renewed bullish interest at this price zone, indicating that buyers are actively defending the level.
However, the Relative Strength Index (RSI) remains positioned in the overbought region, signaling that the market may still be vulnerable to a short-term correction below the critical $0.20 mark. Despite this, the sustained buying pressure at the support level hints at underlying bullish resilience, which could limit the depth of any potential pullback.