Magic Eden (ME/USD) Breaks Deadlock as Price Surges to $0.6
Estimated Reading Time: 3 minutes
Don’t invest unless you’re prepared to lose all the money you invest. This is a high-risk investment and you are unlikely to be protected if something goes wrong. Take 2 minutes to learn more
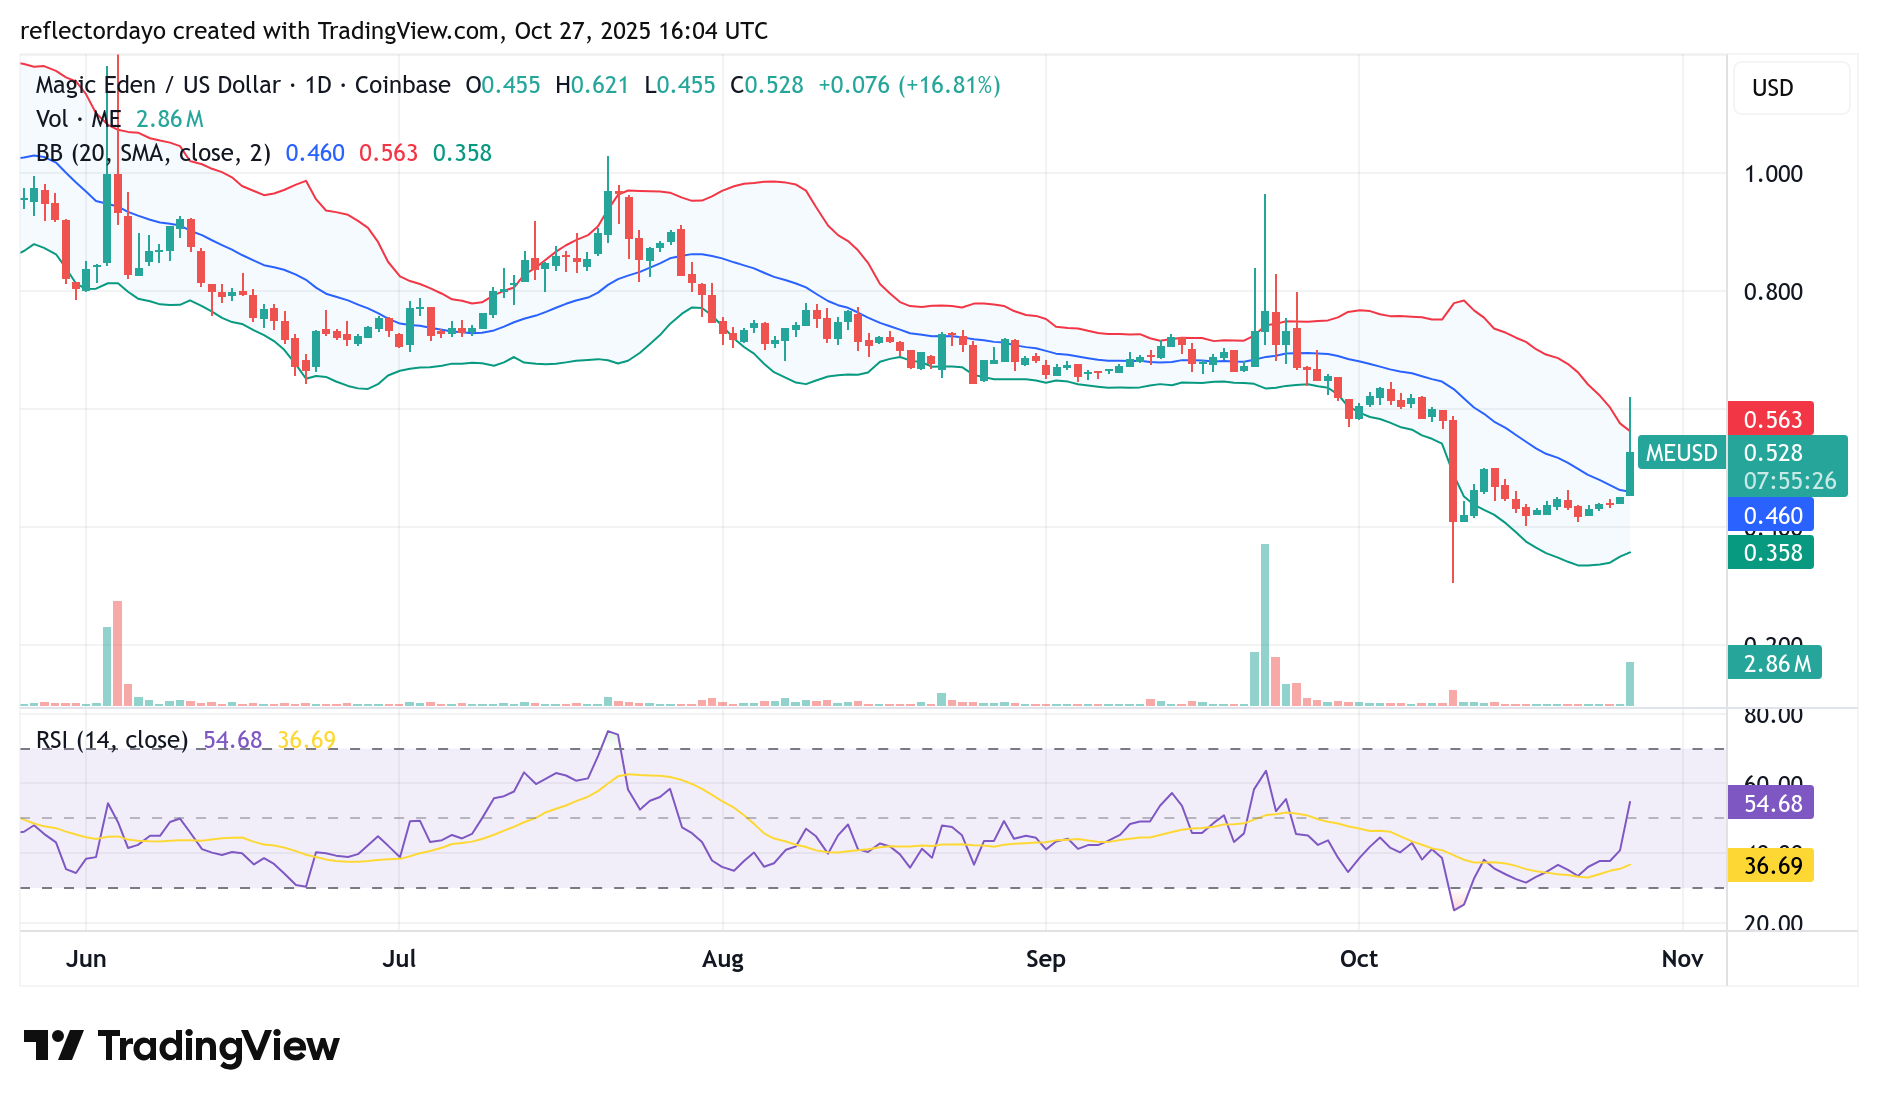
A period of consolidation preceded the recent bearish price action observed around October 10. However, in today’s trading session, strong buying momentum in the Magic Eden market has re-emerged, driving a significant breakout from the $0.45 level. The bullish move propelled the price to a peak of $0.6 before a corrective pullback brought it back to stabilize around $0.53.
Magic Eden (ME/USD) Market Data
- ME/USD Price Now: $0.53
- ME/USD Market Cap: $88.5 million
- ME/USD Circulating Supply: 167 million ME
- ME/USD Total Supply: 999 million ME
- ME/USD CoinMarketCap Ranking: #357
Key Levels to Watch
- Resistance: $0.60, $0.65, $0.70
- Support: $0.45, $0.40, $0.35
Magic Eden (ME/USD) Daily Chart Outlook
Today’s price movement has effectively halted the recent bearish trend, with the price holding firm above the sloping 20-day moving average. This indicates that the market may be transitioning into an upward phase — a potential shift favoring bullish traders.
Market sentiment appears to be strengthening, and momentum is tilting toward the upside. However, the wide bandwidth of the Bollinger Bands suggests that volatility remains elevated, leaving room for sudden and significant price swings. The RSI also reflects sharp movements, reinforcing the current volatile conditions.
If the bulls lose their grip around the $0.50 level, another strong bearish move could occur. The Magic Eden traders may therefore consider waiting for a confirmed hold above $0.50 before entering new long positions. The next daily session will likely provide more clarity on the market’s directional bias.
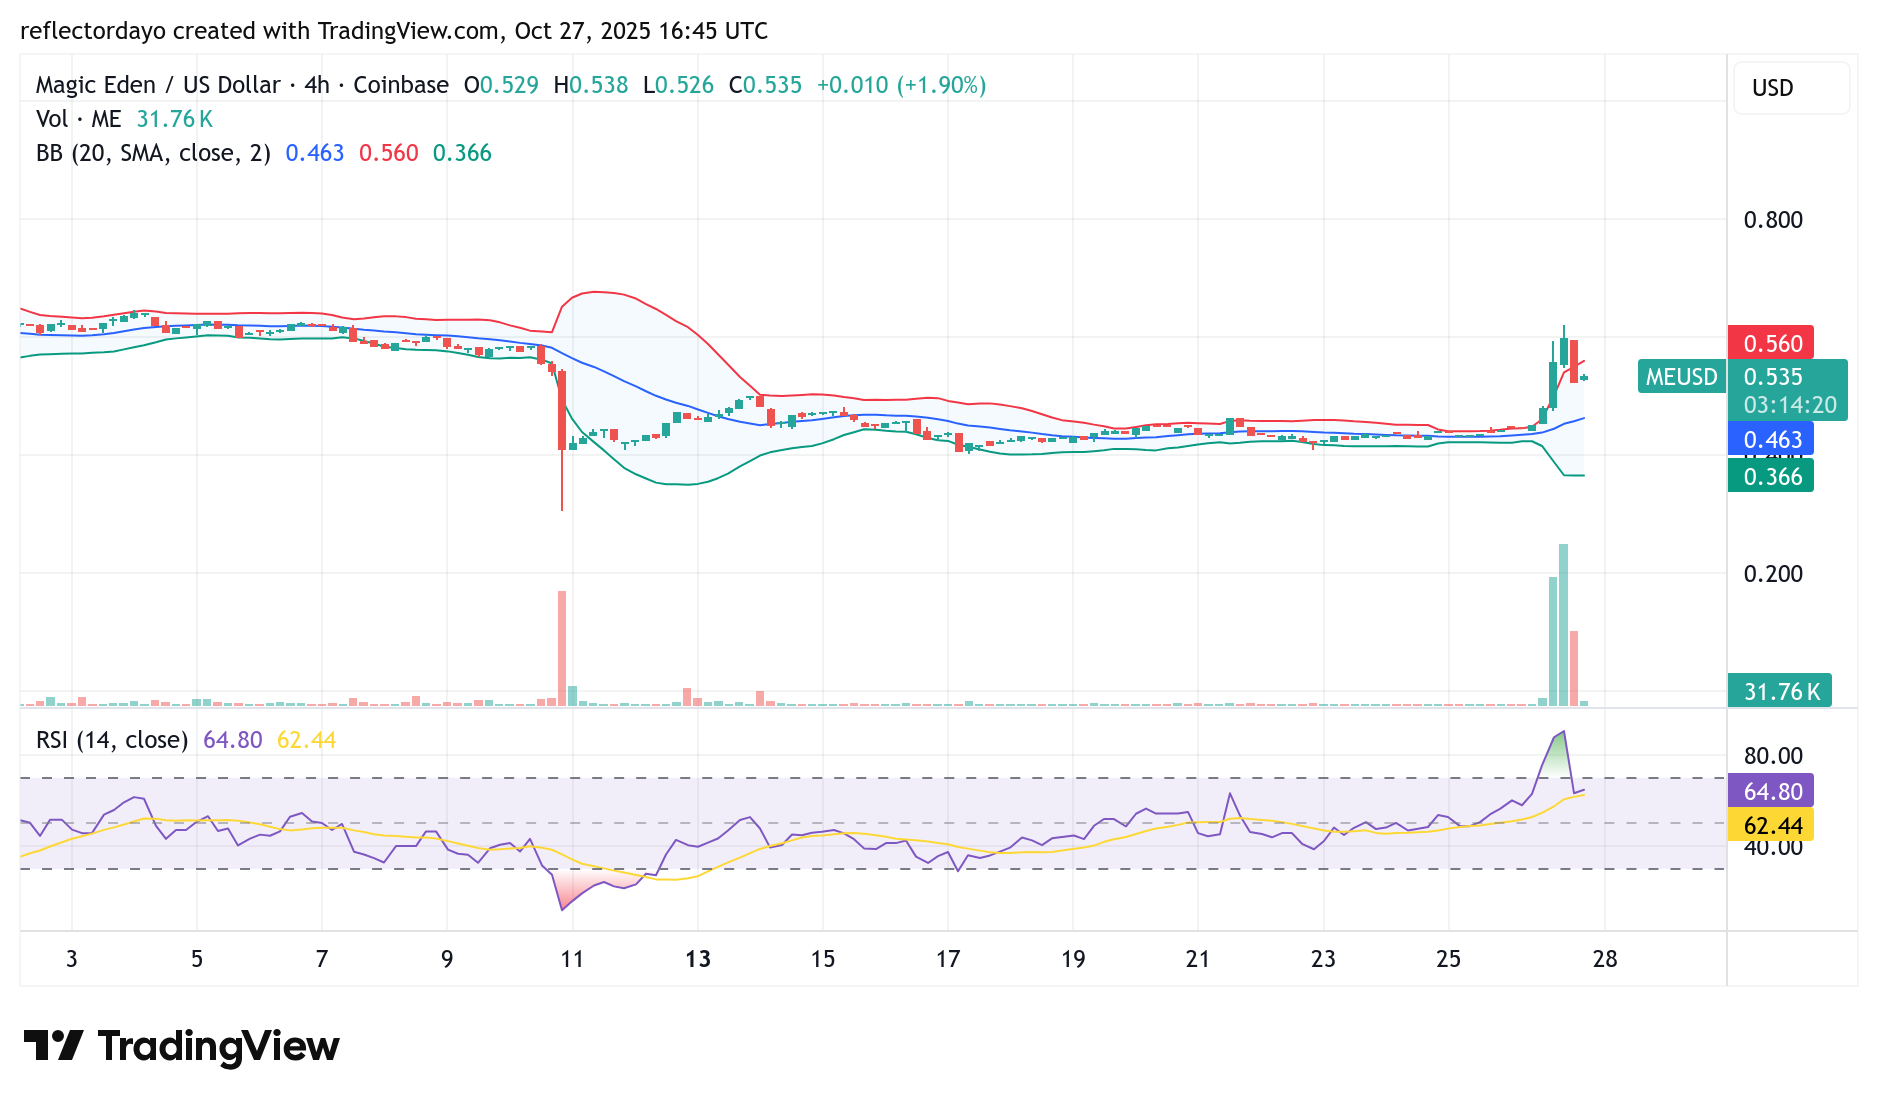
ME/USD 4-Hour Chart Outlook
Zooming into the shorter timeframe provides a clearer perspective on the Magic Eden (ME/USD) market. In the current 4-hour session, a four-price Doji has formed following a bearish Marubozu candlestick — a pattern that signals the ongoing bearish correction may be encountering strong support around the $0.53 level.
Although the Bollinger Bands indicate continued volatility, the declining height of the volume histograms suggests a slowdown in selling pressure. If this level holds, it could serve as a key support zone, potentially allowing bullish momentum to regain strength and push the market upward.