Bitcoin Cash (BCH/USD) Bulls Gain Strength From the $480 Price Level
Estimated Reading Time: 3 minutes
Don’t invest unless you’re prepared to lose all the money you invest. This is a high-risk investment and you are unlikely to be protected if something goes wrong. Take 2 minutes to learn more

Recently, the Bitcoin Cash market has experienced significant bearish momentum, driving prices down from the $600 region. Although selling pressure dominated the early phase of the decline, opportunistic traders began accumulating at lower levels, leading to sharp price swings within the market. Despite this volatility, bearish sentiment remained in control, pushing the price further downward.
However, at the critical $480 support level, bullish traders regained confidence, establishing a solid base that has since fueled a recovery. This renewed buying interest suggests that the $480 level is now serving as a key foundation for a potential bullish reversal.
Bitcoin (BTC/USD) Market Data
- BCH/USD Price Now: $502
- BCH/USD Market Cap: $10 billion
- BCH/USD Circulating Supply: 19.9 million BCH
- BCH/USD Total Supply: 19.9 million BCH
- BCH/USD CoinMarketCap Ranking: #15
Key Levels to Watch
- Resistance: $520, $560, $600
- Support: $480, $440, $400
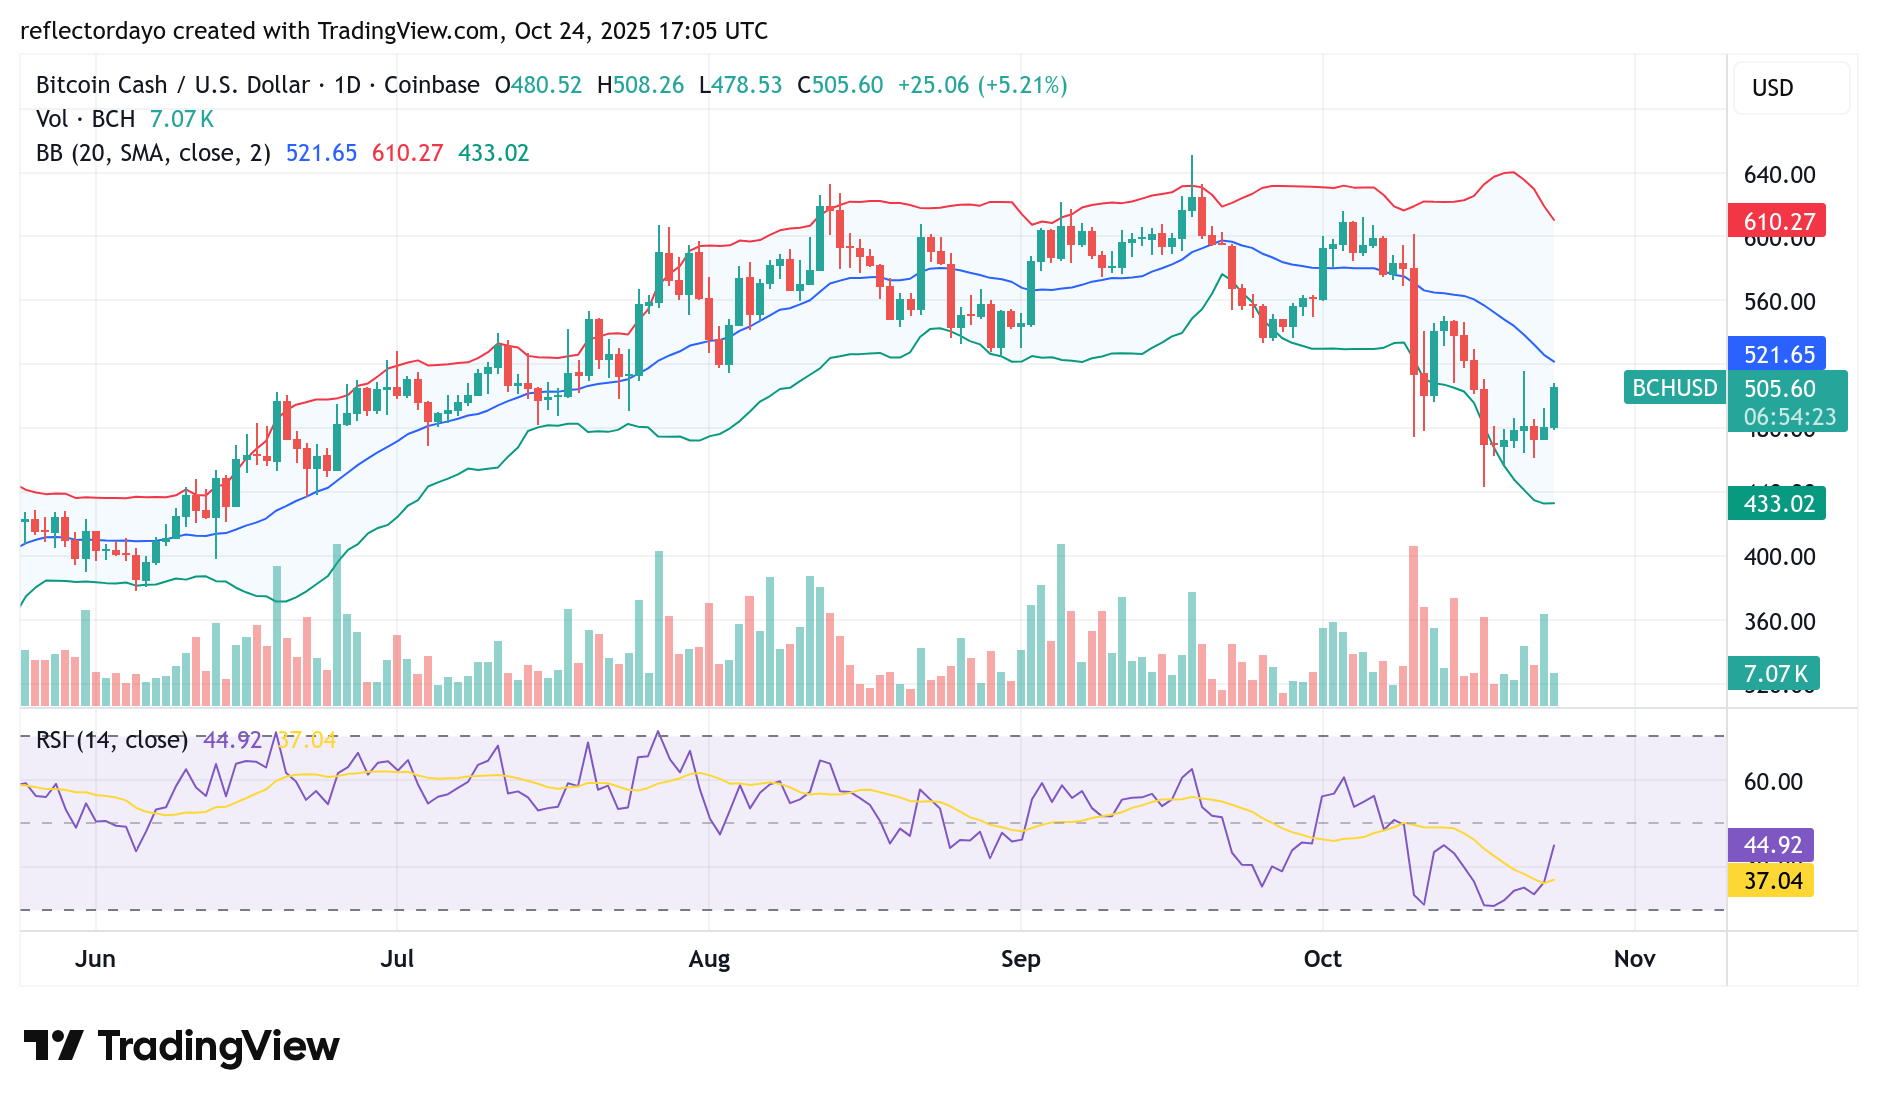
Bitcoin Cash (BCH/USD) Daily Chart Outlook
The candlestick representing today’s trading activity is notably strong, highlighting clear bullish dominance in the Bitcoin Cash market. However, the accompanying trading volume histogram is relatively weak compared to the size of the bullish candlestick. Typically, a large candlestick with low trading volume suggests that the price movement was not broadly supported across the market.
This kind of setup often indicates that the rally in the crypto signal may have been driven by a few large trades or short-term speculative activity rather than widespread investor participation. While such movements can sometimes attract additional buyers and fuel further gains, they can also prove unsustainable if broader market support fails to materialize. The behavior of the next trading session will be crucial in confirming whether the current momentum can hold or if a correction might follow.
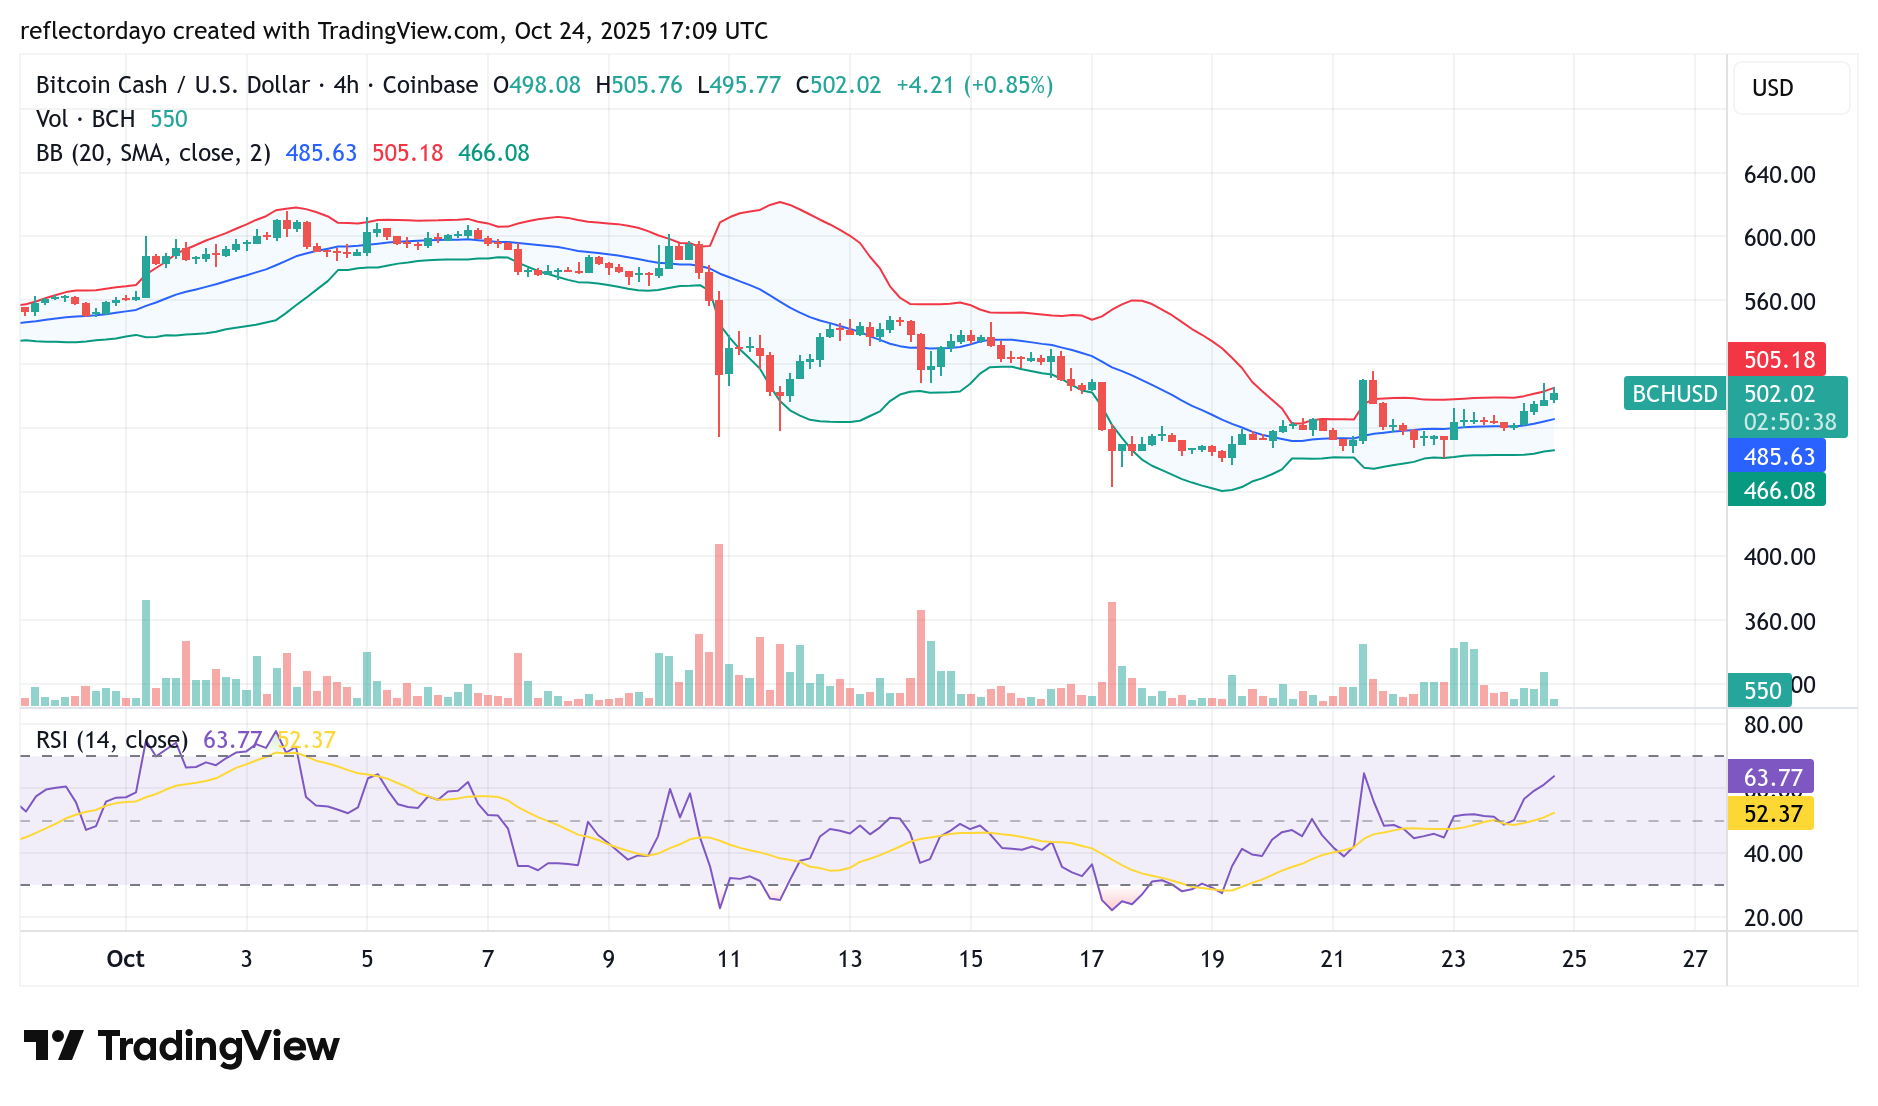
BCH/USD 4-Hour Chart Outlook
Confirming the observations from the daily chart, market participation remains relatively low compared to the pace of the ongoing upward movement. At present, a key resistance level has been identified at $506. Traders are likely monitoring this level closely, as a breakout above it could attract increased buying interest and potentially drive the market higher toward the $600 price zone.