Helium (HNT/USD) Bulls Reclaim the $2.00 Level
Estimated Reading Time: 3 minutes
Don’t invest unless you’re prepared to lose all the money you invest. This is a high-risk investment and you are unlikely to be protected if something goes wrong. Take 2 minutes to learn more

Recent market volatility pushed the Helium (HNT/USD) pair downward from its position near the $2.50 price level. Initially, bullish sentiment attempted to defend the $2.00 support zone; however, the buying pressure weakened, leading to a breakdown below this level on October 17. The market subsequently found a new support base around the $1.80 price level.
In today’s trading session, however, Helium has shown a strong recovery—surging by approximately 16.8% to reclaim the critical $2.00 price level. This sharp rebound reflects renewed bullish interest and could signal the beginning of a potential short-term recovery phase if momentum continues to build above this threshold.
Helium (HNT/USD) Market Data
- HNT/USD Price Now: $2.076
- HNT/USD Market Cap: $381 million
- HNT/USD Circulating Supply: 186 million HNT
- HNT/USD Total Supply: 186 million HNT
- HNT/USD CoinMarketCap Ranking: #127
Key Levels to Watch
- Resistance: $2.30, $2.40, $2.50
- Support: $2.00, $1.80, $1.50
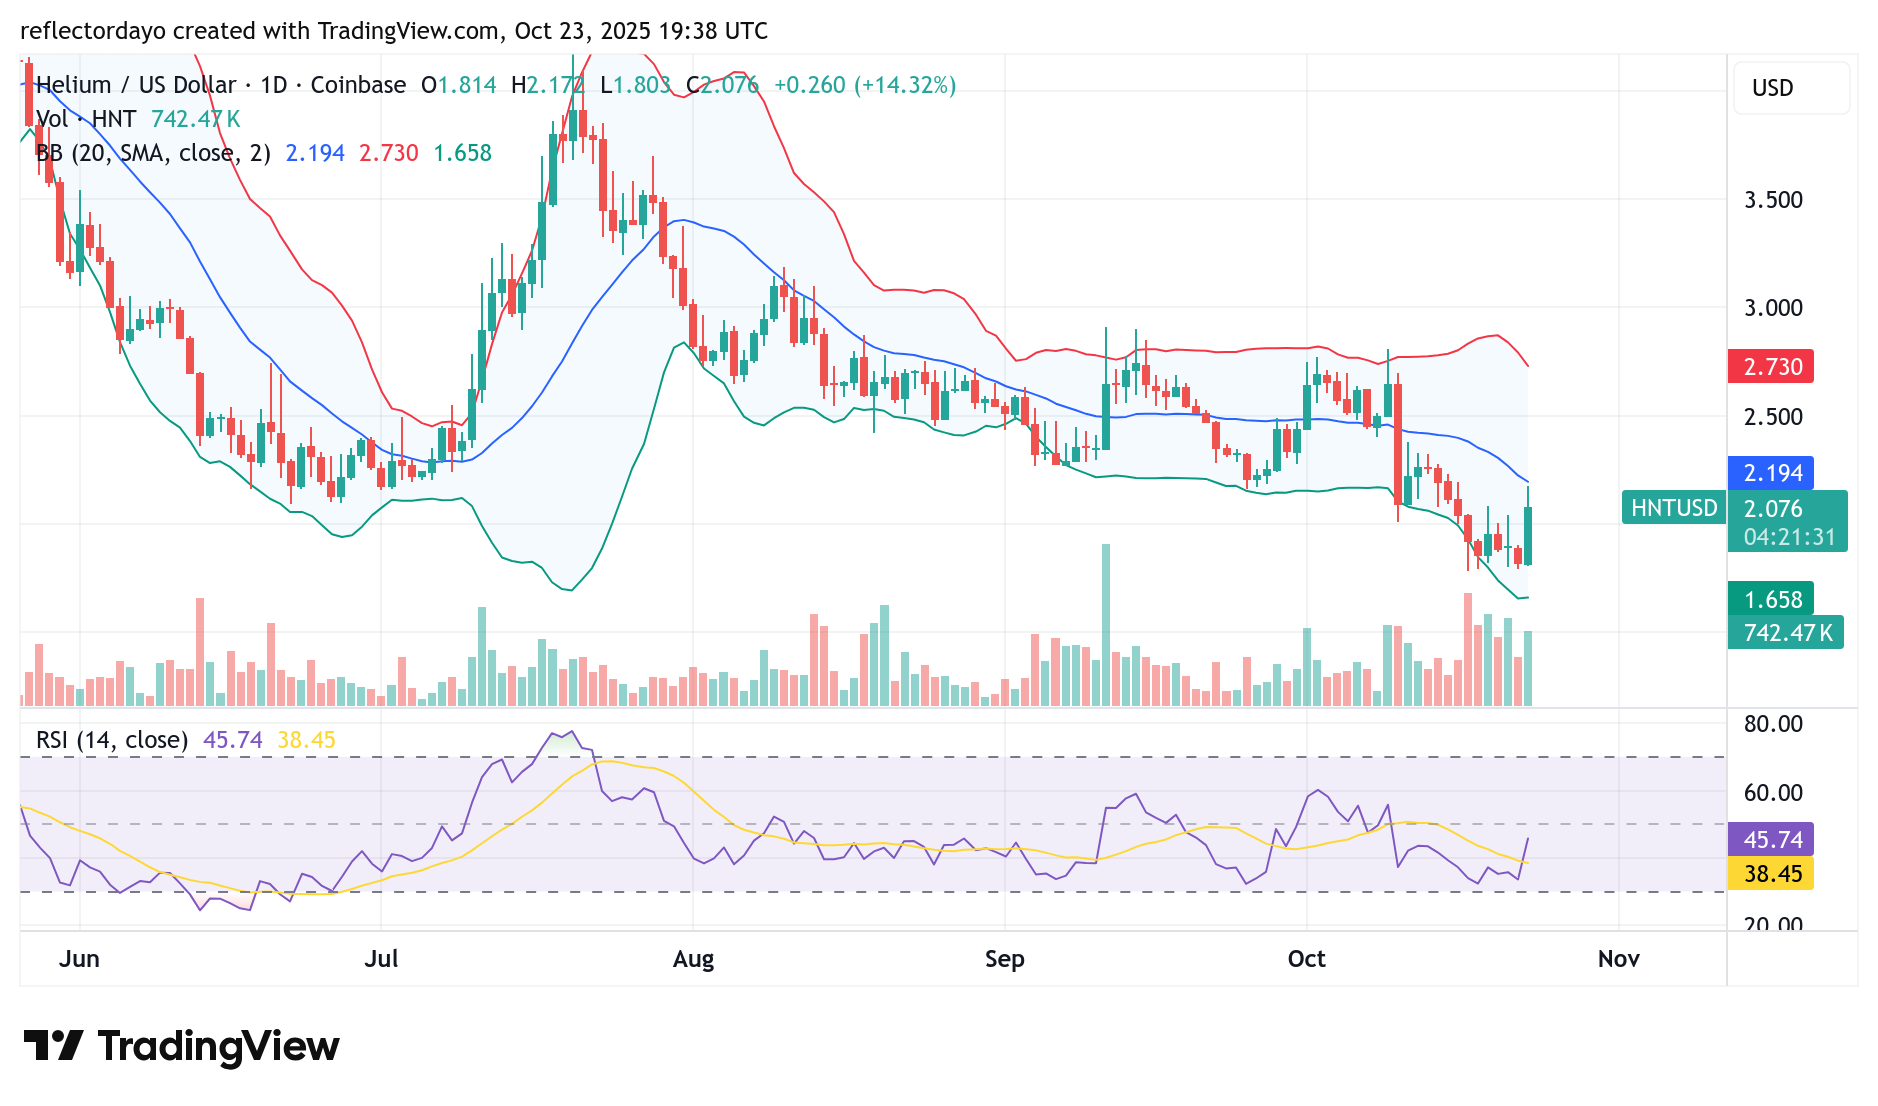
Helium (HNT/USD) Daily Chart Outlook
The Helium market is currently attempting to recover from the bearish zone, as reflected by key technical indicators. Both the Bollinger Bands and the Relative Strength Index (RSI) show readings in their lower regions, suggesting that bearish pressure still dominates the market.
Additionally, recent trading volume histograms reveal strong market activity, indicating that while traders remain active, many are exercising caution around the critical $2.00 price level. This suggests that although selling interest persists, participants are closely monitoring this threshold for possible trend reversal signals.
The Bollinger Band’s wide bandwidth further highlights ongoing volatility, implying that price action around the $2.00 level could continue to fluctuate both above and below it. However, if the bulls can sustain momentum and keep the price action steady above the $2.00 mark, a continued recovery toward the $2.50 resistance level appears likely.
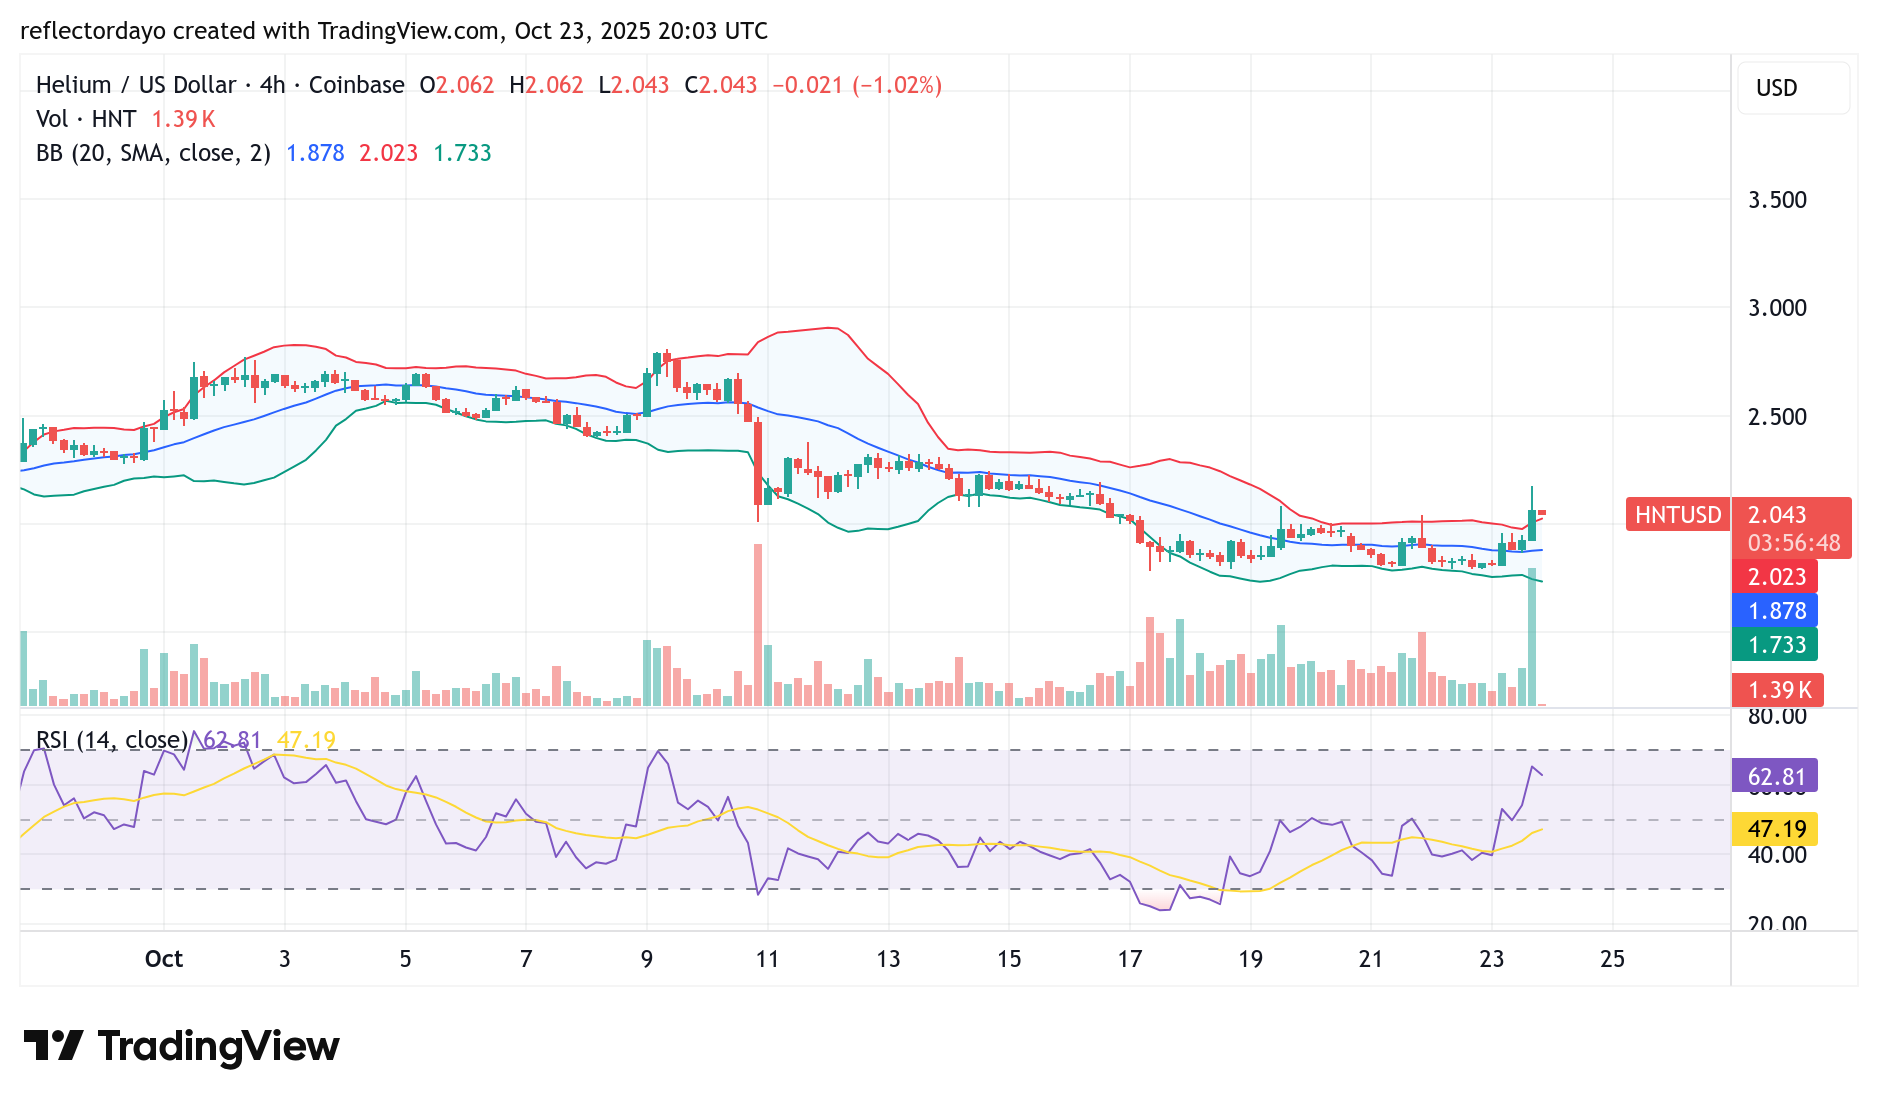
HNT/USD 4-Hour Chart Outlook
The substantial increase in trading volume amid a breakout above the key $2.00 resistance could suggest that the market is entering a strong accumulation phase. The heightened activity reflects robust participation, potentially from institutional or large-scale buyers absorbing available sell orders. This scenario implies that the market may be building momentum for a more sustainable upward movement. If price action remains stable above $2.00 in the coming sessions, it would confirm a successful breakout, paving the way for a potential rally toward the next resistance zones at $2.30 and $2.50.
Conversely, the massive volume accompanying a relatively small bullish candle might indicate distribution rather than accumulation. In this case, large holders may be selling into strength, taking advantage of the breakout to offload positions. This could signal a possible bull trap, where bullish momentum quickly fades after the breakout. If subsequent candles fail to sustain above $2.00 and begin to show rejections or bearish patterns, the market could retreat below the breakout point, revisiting $1.90 or even $1.80 support levels.