Solana (SOL) Price Prediction: SOL/USDT Needs More Catalysts
Estimated Reading Time: 3 minutes
Don’t invest unless you’re prepared to lose all the money you invest. This is a high-risk investment and you are unlikely to be protected if something goes wrong. Take 2 minutes to learn more

Date: August 22, 2025
For about a week now, ever since price activity in the Solana market retreated back below the $200 mark, price movement has been somewhat inconsistent. For the most part, however, the market has still been able to remain above key technical levels. This at least continues to support bullish hopes for later.
Long-Term Trend—Bullish (Daily Chart)
Key Price Levels:
Resistance: $200, $210, $220
Support: $180, $170, $160
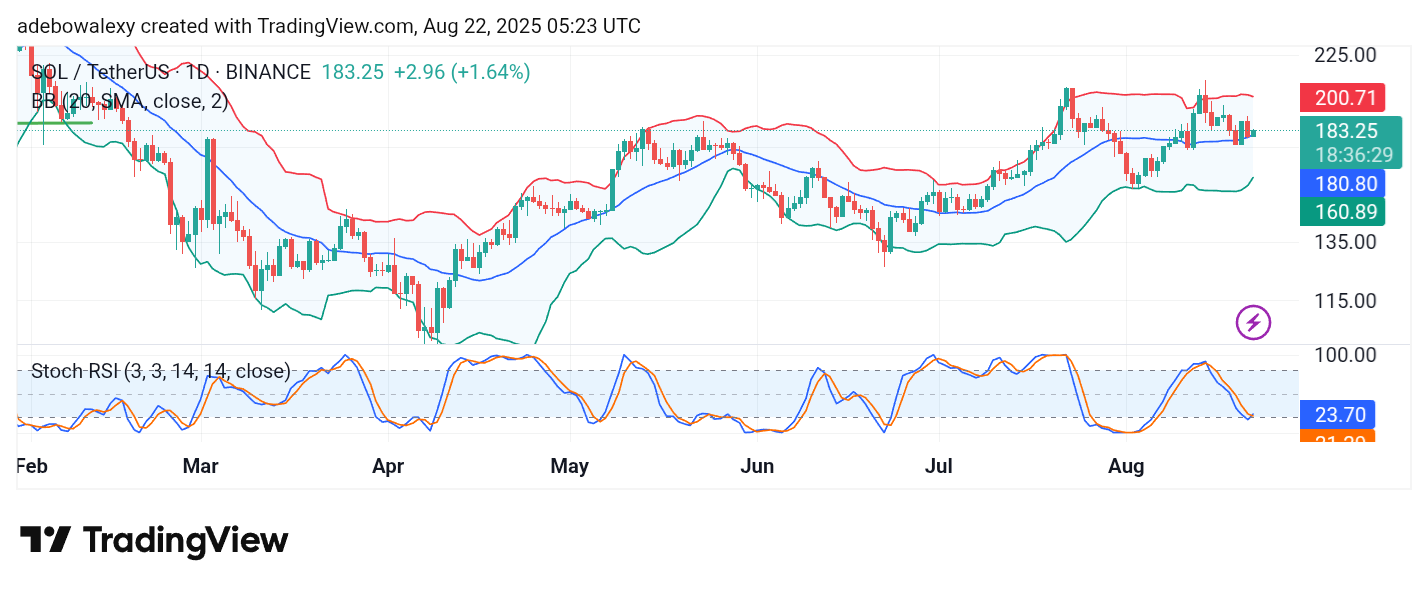
The ongoing session in the Solana daily market is bullish. The last price candle on this chart is a bullish one, and it stands just above the middle band of the Bollinger Bands (BB) indicator. The BB indicator itself can be seen contracting, with the lowest band also tightening. At the same time, the Stochastic Relative Strength Index (SRSI) indicator lines have delivered an upside crossover just above the 20 mark of the indicator.
Solana (SOL) Price Prediction: SOL/USDT Has a Bullish Focus
With price activity in the Solana daily chart resiliently keeping its base above the middle band of the BB indicator, it seems buyers are quietly waiting in the shadows. The contraction of both the upper and lower bands of the BB indicator, as well as its slight upward slope, suggests bulls may be gradually strengthening their position in the market.
The BB indicator also shows a mild upward bearing, which further hints at the likely path of the market. In addition, the SRSI has delivered another upward crossover just above the 20 mark of the indicator. This likewise suggests that the market is predisposed to edging upward henceforth.
Solana (SOL) Price Prediction: SOL/USDT Continues to Edge Upward Minimally (4-Hour Chart)
The Solana 4-hour price chart has pushed upward for the third consecutive session. Similarly, the ongoing session has kept the coin trading just above the middle band of the BB indicator.
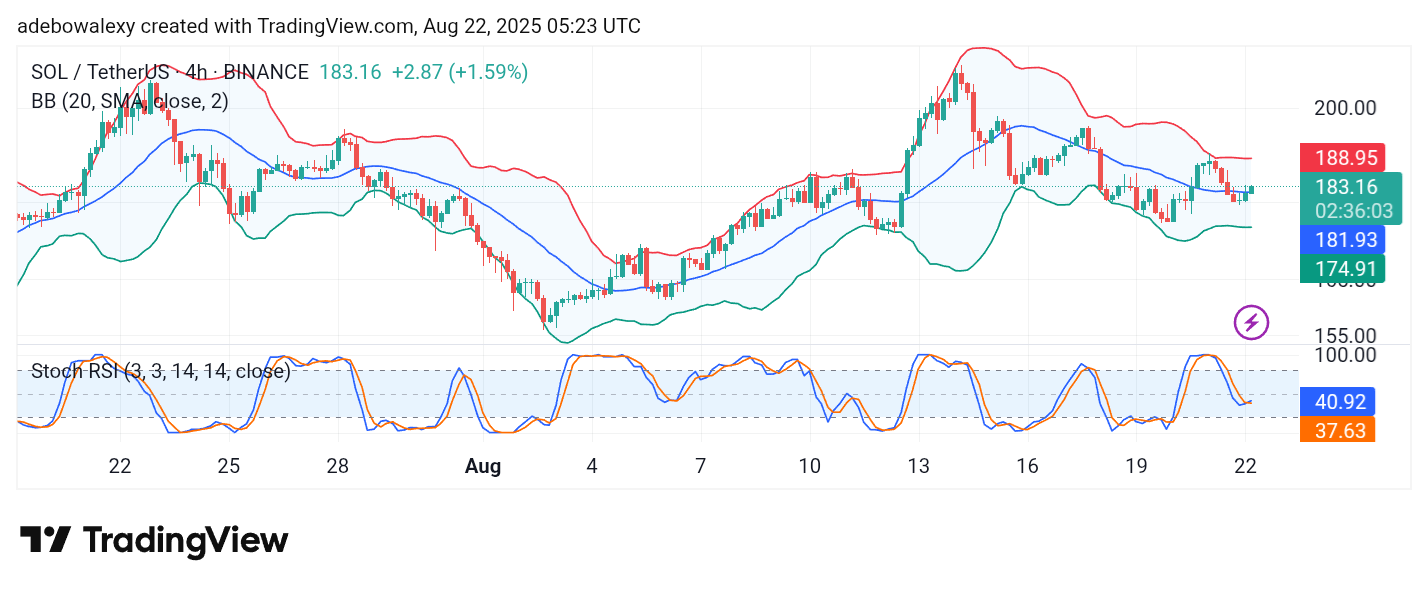
This is consistent with the stance of price action on the daily chart. Likewise, a bullish crossover can be noticed on the applied SRSI indicator lines. Consequently, the available indications reinforce the expectation that this market may continue heading upward. Therefore, traders can begin aiming at the $200 price level, as price action may proceed even beyond this level.