Solana (SOL) Price Prediction: SOL/USDT Remains Bullish Despite Failing to Sustain Trading Above $200
Estimated Reading Time: 2 minutes
Don’t invest unless you’re prepared to lose all the money you invest. This is a high-risk investment and you are unlikely to be protected if something goes wrong. Take 2 minutes to learn more

Date: August 15, 2025
The Solana market recently witnessed a strong price surge, which saw the token’s value rise decisively through a medium-term resistance at the \$200 price level. However, this surge attracted bearish attention, causing the market to retreat downward.
Long-Term Trend — Bearish (Daily Chart)
Key Price Levels:
Resistance: $200, $220, $240
Support: $190, $180, $170
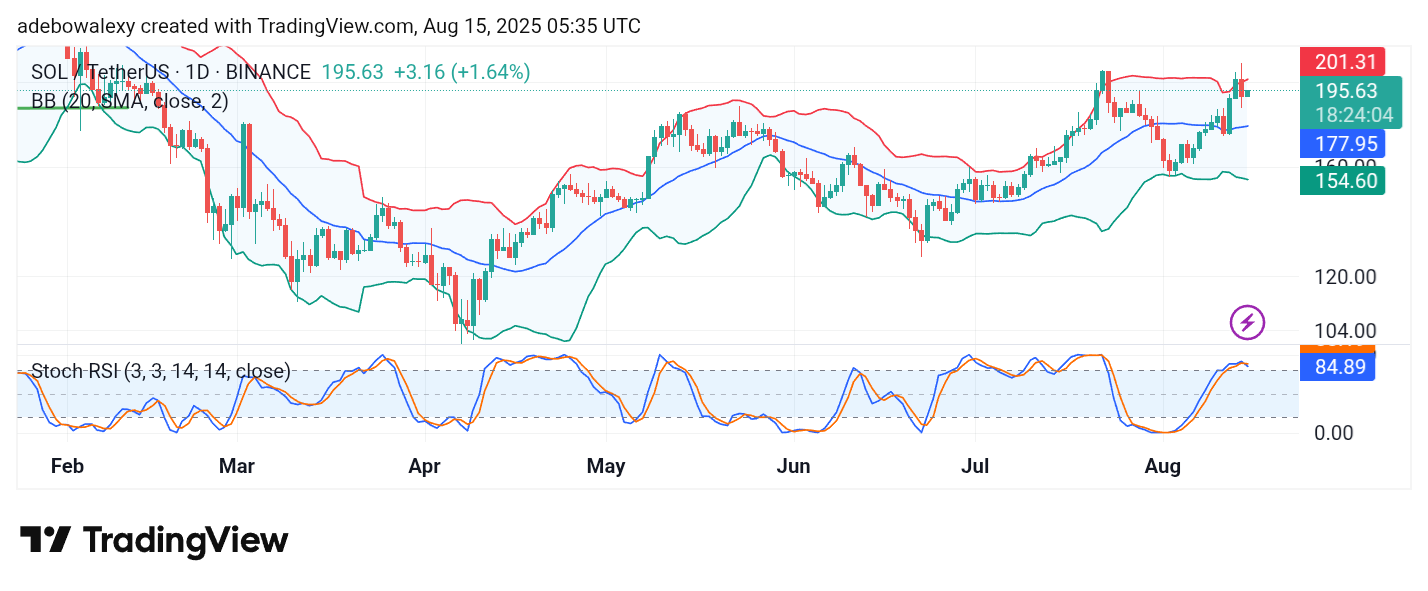
Although price action has retreated below key technical levels, the ongoing session is still represented by a green price candle. Price action also remains significantly above the middle band of the Bollinger Bands (BB) indicator. Meanwhile, the Stochastic Relative Strength Index (SRSI) indicator lines have risen high into the overbought region, but their terminal session seems to have a downward trajectory as they appear tangled there.
Solana (SOL) Price Prediction: SOL/USDT Upward Retracement Gets Interrupted
The Solana market, judging by the recent price chart activity, has experienced notable gains in recent sessions. However, this upward movement has been interrupted by bearish sentiment, causing the market to retreat below the uppermost band of the BB indicator. Nevertheless, the appearance of the latest price candle on the daily chart suggests bullish persistence.
Additionally, the SRSI lines remain in the overbought region but appear tangled, indicating the influence of bearish pressure. Still, their position in the overbought zone shows that bullish forces remain influential in the market.
Solana (SOL) Price Prediction: SOL/USDT Sees a Positive Bounce (4-Hour Chart)
On the Solana 4-hour chart, price action has rebounded off the support at the middle band of the BB indicator. The latest price candle is a green one, suggesting that buyers are attempting to regain control of the market. The BB indicator also maintains its upward tilt.
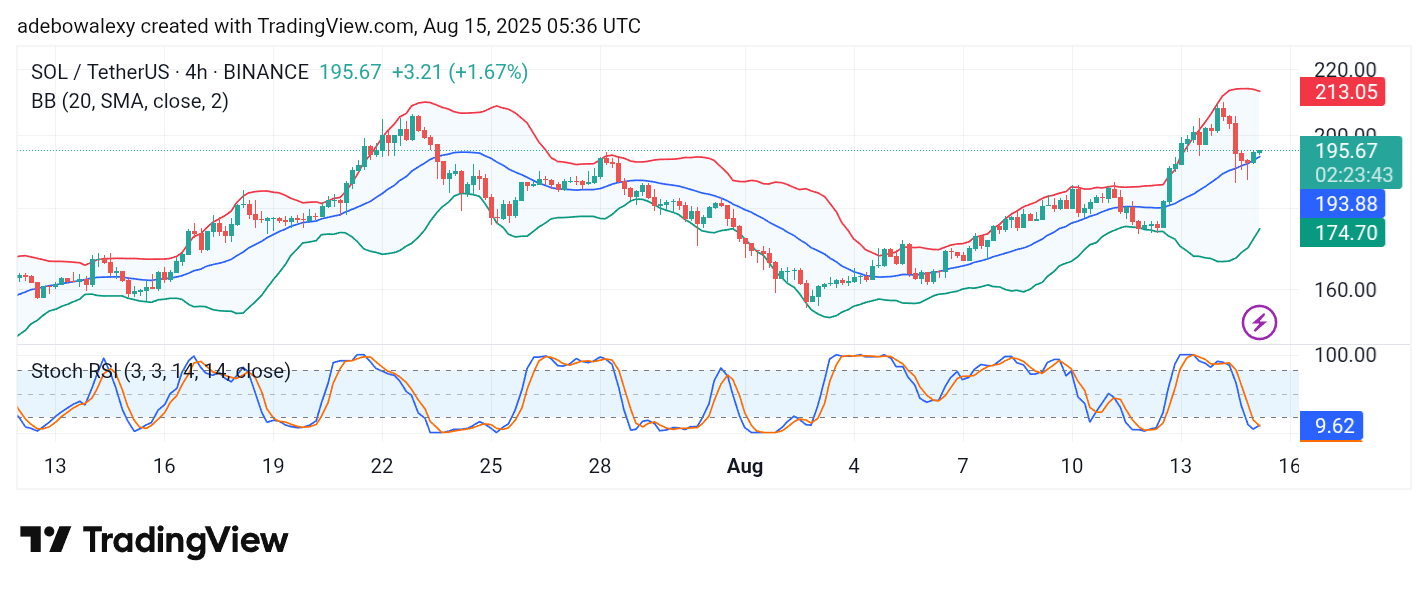
At the same time, the SRSI indicator lines have converged in the oversold region, which technically signals that the market is gathering bullish momentum. Therefore, traders may start targeting the $200 price level again, as the market could soon resurface above this mark.