Solana (SOL) Price Prediction: SOL/USDT Faces a Crucial Technical Barrier
Estimated Reading Time: 3 minutes
Don’t invest unless you’re prepared to lose all the money you invest. This is a high-risk investment and you are unlikely to be protected if something goes wrong. Take 2 minutes to learn more

Date: August 8, 2025
Solana has staged a modest recovery following a recent pullback, but bullish momentum is now being tested at a key resistance zone. A decisive break above this level could pave the way for stronger upside potential in the coming sessions.
Long-Term Trend — Bullish (Daily Chart)
Key Price Levels:
Resistance: $175, $185, $195
Support: $170, $160, $150
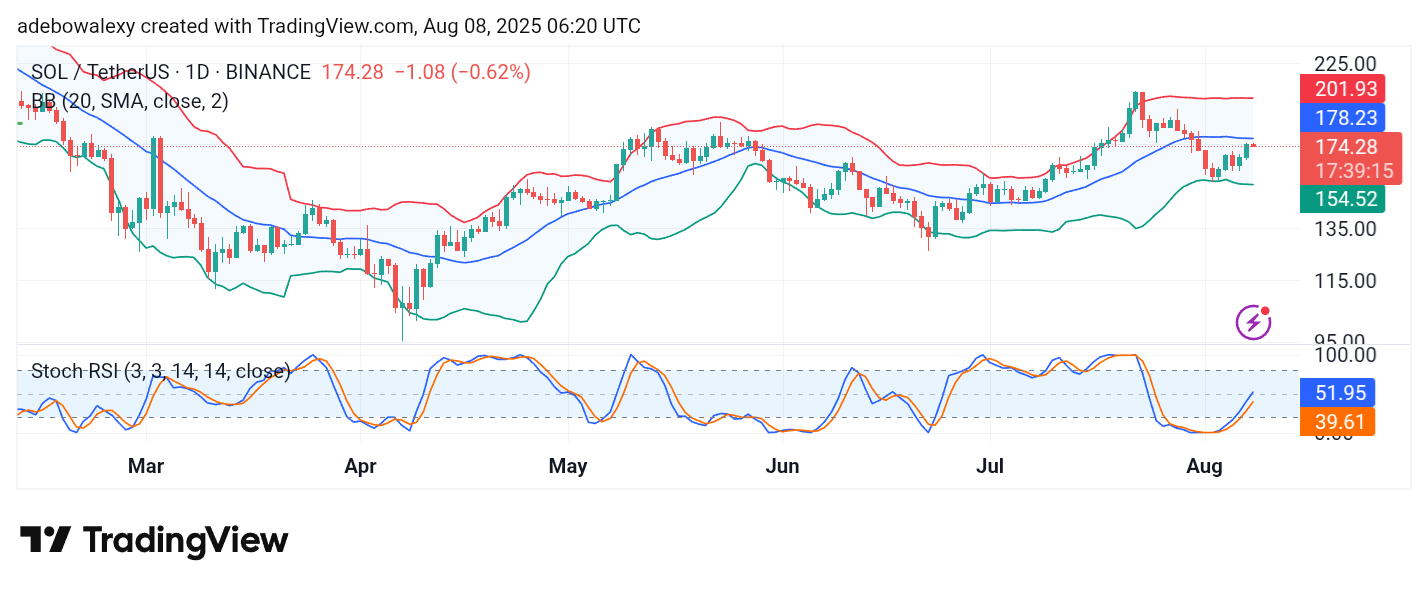
On the daily chart, Solana has rebounded from support at the lower Bollinger Band (BB), climbing toward the middle band. Despite this upward push, the current session is marked by a small red candle, signaling cautious sentiment among traders.
The Stochastic Relative Strength Index (SRSI) continues to trend upward from the oversold territory, indicating that bullish momentum remains in play. However, the immediate challenge lies in overcoming the $175–$178 resistance range.
Key Price Outlook: Breach of $178.23 Could Trigger Stronger Gains
Price action suggests that the Solana market is encountering firm resistance, as selling pressure attempts to cap further advances. Nonetheless, the trajectory of the SRSI lines points to sustained bullish momentum, while the BB indicator has started to level off — a sign of possible price stabilization before the next move.
A successful breakout above $178.23 would confirm renewed buying strength, potentially opening the path toward the $185 and $195 resistance levels in the medium term.
Short-Term Trend — Minimal Pullback on the 4-Hour Chart
In the shorter time frame, SOL has recorded a mild pullback for the second consecutive session after touching the upper Bollinger Band.
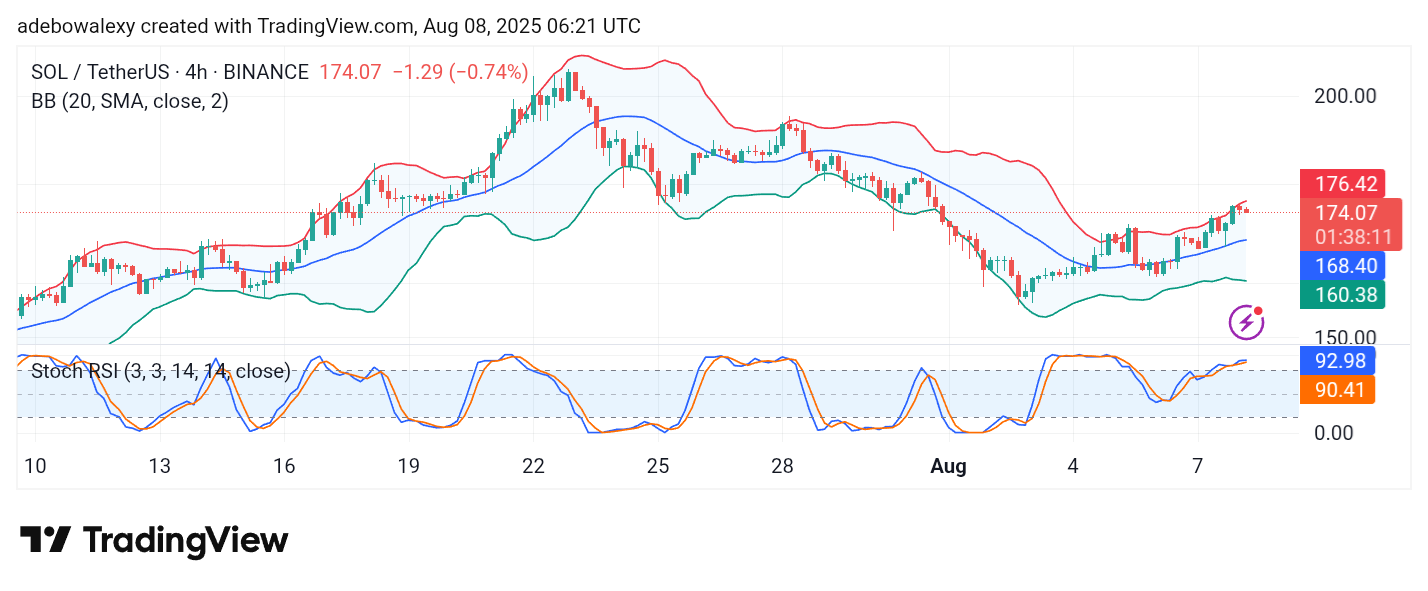
The retracement remains shallow, with the BB bands still expanding upward — a structure typically supportive of continued bullish pressure.
The SRSI line also maintains an upward bias, though it is nearing the 100 level, which may hint at overbought conditions in the near term. Should buyers maintain control, the market could quickly regain momentum toward the $180 price level.
Technical Summary:
- The daily chart reflects an overall bearish trend but with near-term bullish recovery signals.
- Resistance at $178.23 is the key breakout trigger for stronger gains.
- Both the daily and 4-hour charts suggest that momentum remains intact, though short-term consolidation may occur before any significant rally.