Solana (SOL) Price Prediction: SOL/USDT Extends Its Nosedive
Estimated Reading Time: 2 minutes
Don’t invest unless you’re prepared to lose all the money you invest. This is a high-risk investment and you are unlikely to be protected if something goes wrong. Take 2 minutes to learn more

Date: August 1, 2025
Price action in the Solana market has been under intense selling pressure ever since it breached the $200 price level. As a result, the market now heads toward a psychological support level around the $160 price mark.
SOL/USDT Long-Term Trend — Bearish (Daily Chart)
Key Price Levels:
Resistance: $170, $180, $190
Support: $160, $150, $140
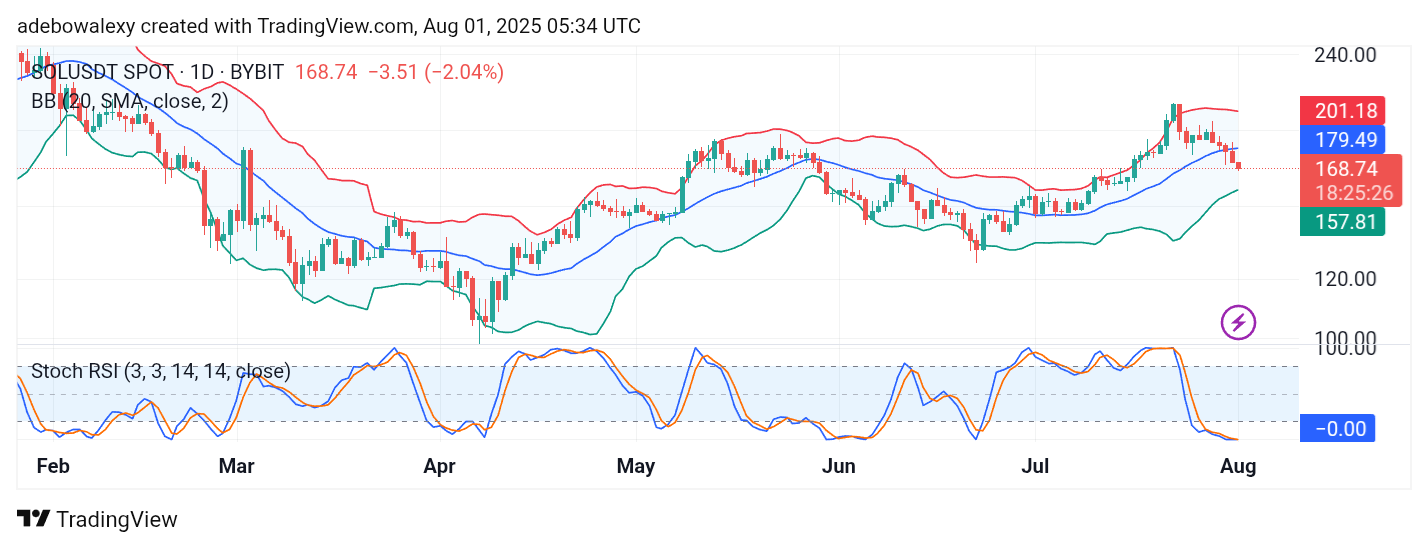
The ongoing session in the Solana market has maintained the market’s southward trajectory. This is evident from the red appearance of the latest price candle on the chart. Additionally, the candle now stands below the midline of the Bollinger Bands (BB) indicator. Nevertheless, the BB indicator currently shows a slight sideways trajectory at its terminals.
Meanwhile, the lines of the Stochastic Relative Strength Index (SRSI) have reached the lower boundary of the oversold region, and an upward crossover has not yet occurred.
Solana Price Prediction: SOL/USDT Market Eyes the $160 Price Level
The Solana market has continued moving southward after breaching the midline support of the BB indicator in the previous session. The ongoing session remains bearish and continues further below the midline. This technically signals mounting bearish pressure.
Consequently, the lines of the SRSI indicator have not been able to initiate an upward crossover. Therefore, the downward retracement may extend further in this market.
Solana Price Prediction: SOL/USDT Pushes Lower Limits (4-Hour Chart)
On the 4-hour chart, the Solana market reveals that bearish forces remain relentless. As a result, price action has been consistently pushing against lower limits. The ongoing session is also red and continues heading south.
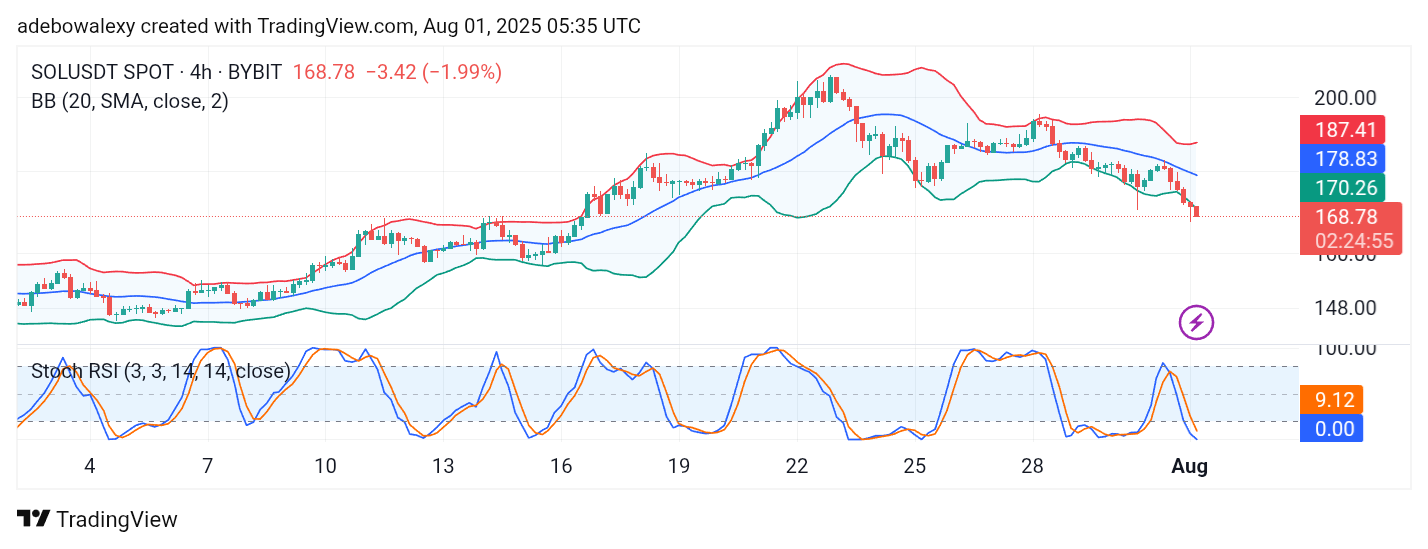
The latest price candle on this chart lies below the lower band of the BB indicator. Likewise, the SRSI indicator lines appear set to remain in the oversold region. This is consistent with the signals observed on the daily chart and supports the likelihood of prices descending further toward the $160 price level.