Uniswap (UNI) Price Prediction: UNI/USDT Rebounds Upward from Above $10.00
Estimated Reading Time: 3 minutes
Don’t invest unless you’re prepared to lose all the money you invest. This is a high-risk investment and you are unlikely to be protected if something goes wrong. Take 2 minutes to learn more

Date: July 31, 2025
The Uniswap market has successfully moved through the $8.00, $9.00, and $10.00 price levels. However, it still trades below the $11.00 mark. This may soon change, as price action now appears to be charting a new upward course beyond a key technical threshold.
UNI/USDT Long-Term Trend — Bullish (Daily Chart)
Key Price Levels:
Resistance: $11.00, $12.00, $13.00
Support: $10.00, $9.00, $8.00
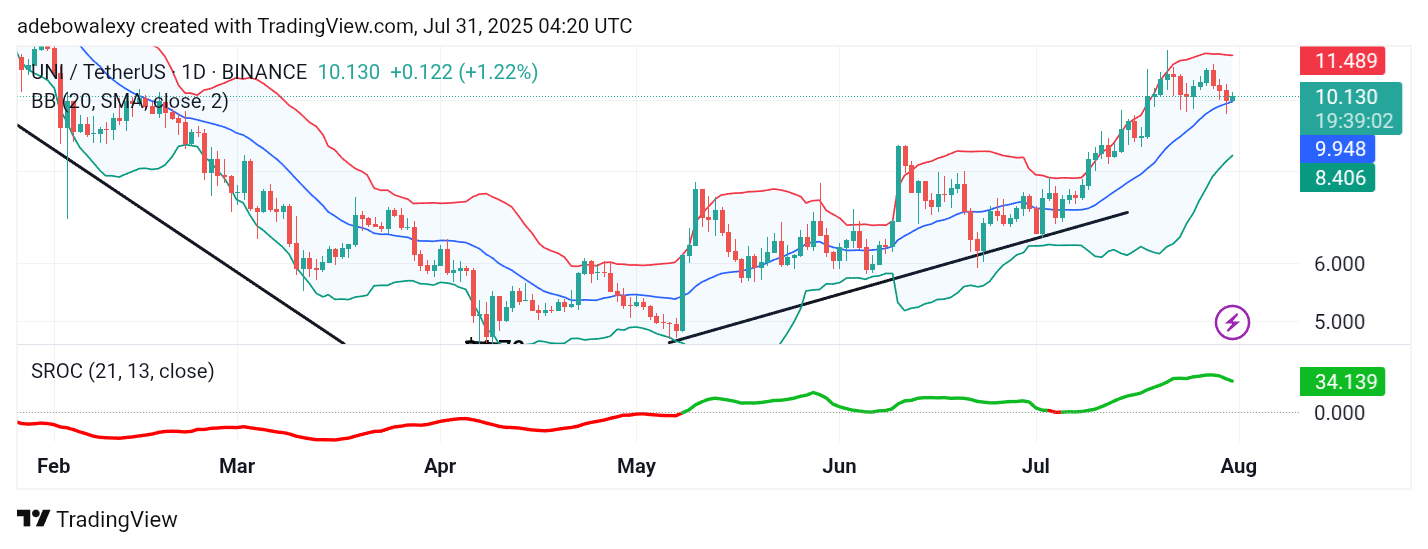
As anticipated, price activity on the Uniswap daily chart has just rebounded from the midline of the Bollinger Bands (BB) indicator. This was confirmed by the appearance of a green candle, signaling renewed bullish momentum. The BB indicator itself maintains an overall upward slope, further reinforcing this outlook.
Meanwhile, the Smoothed Rate of Change (SROC) indicator line remains above the equilibrium level, though it is slightly sloping downward near its endpoint. Despite this, the market still shows positive signs of further upside potential.
Uniswap Price Prediction: UNI/USDT Market Sets a New Upward Course
The observed upward rebound on the Uniswap daily chart provides a solid indication that bullish forces may continue to influence price behavior. While the latest candle appears relatively small, its base formation suggests a potentially strong foundation for further gains.
The BB indicator maintains an upward trajectory, and although the SROC line is slightly descending near its terminal point, it still sits above the equilibrium level. This combination of indicators suggests ongoing market strength, with the potential for continued price growth.
Uniswap Price Prediction: UNI/USDT Maintains a Short-Term Bullish Course (4-Hour Chart)
On the 4-hour chart, UNI/USDT has recently rebounded from support at the lower band of the Bollinger Bands indicator. Following this bounce, price action moved upward but has met minor resistance in the ongoing session, indicated by the appearance of a small red candle.
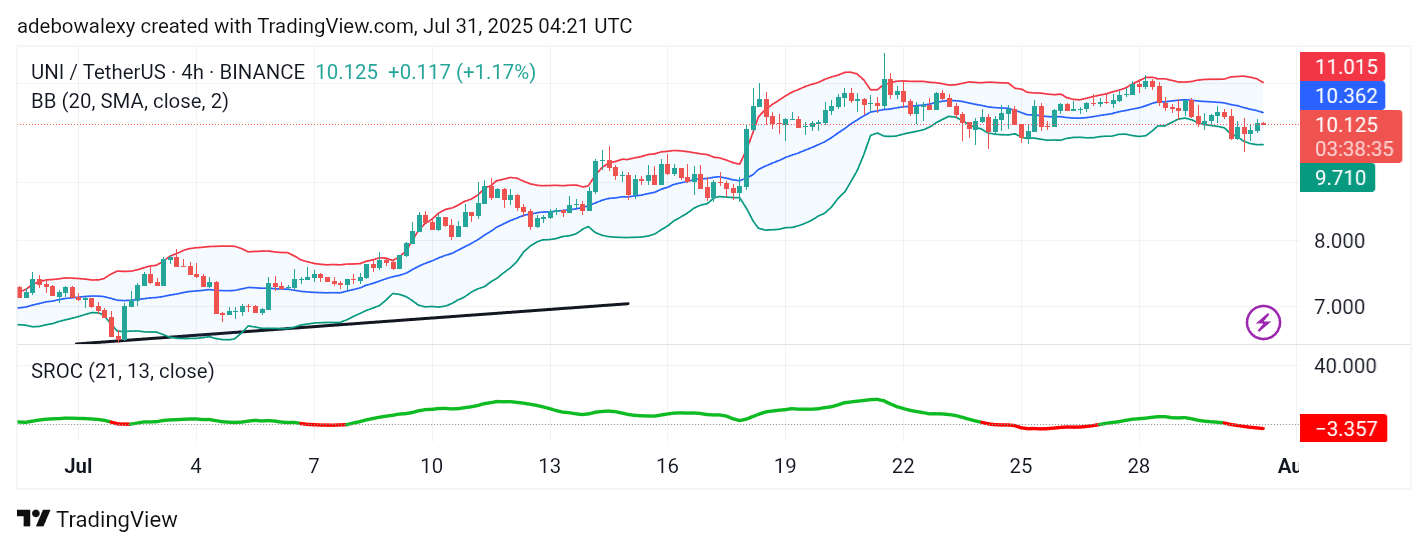
Currently, price remains below the BB midline but is gradually trending toward it. The SROC line is positioned below the equilibrium level and is moving sideways, suggesting reduced but stable momentum.
Traders may consider waiting for price action to rise above the $10.36 mark before targeting the $11.00 or $11.50 resistance levels for potential profit-taking opportunities.