Bitcoin (BTC) Price Prediction: BTC/USDT Market Gathers Momentum for a Possible Upside Thrust
Estimated Reading Time: 2 minutes
Don’t invest unless you’re prepared to lose all the money you invest. This is a high-risk investment and you are unlikely to be protected if something goes wrong. Take 2 minutes to learn more

Date: July 30, 2025
The Bitcoin market has been performing fairly well but has yet to breach the medium-term resistance at the $120,000 price level ahead. The token is currently trading just around the $118,000 price mark.
BTC/USDT Long-Term Trend — Bullish (Daily Chart)
Key Price Levels:
Resistance: $120,000, $122,500, $125,000
Support: $116,500, $114,500, $112,000
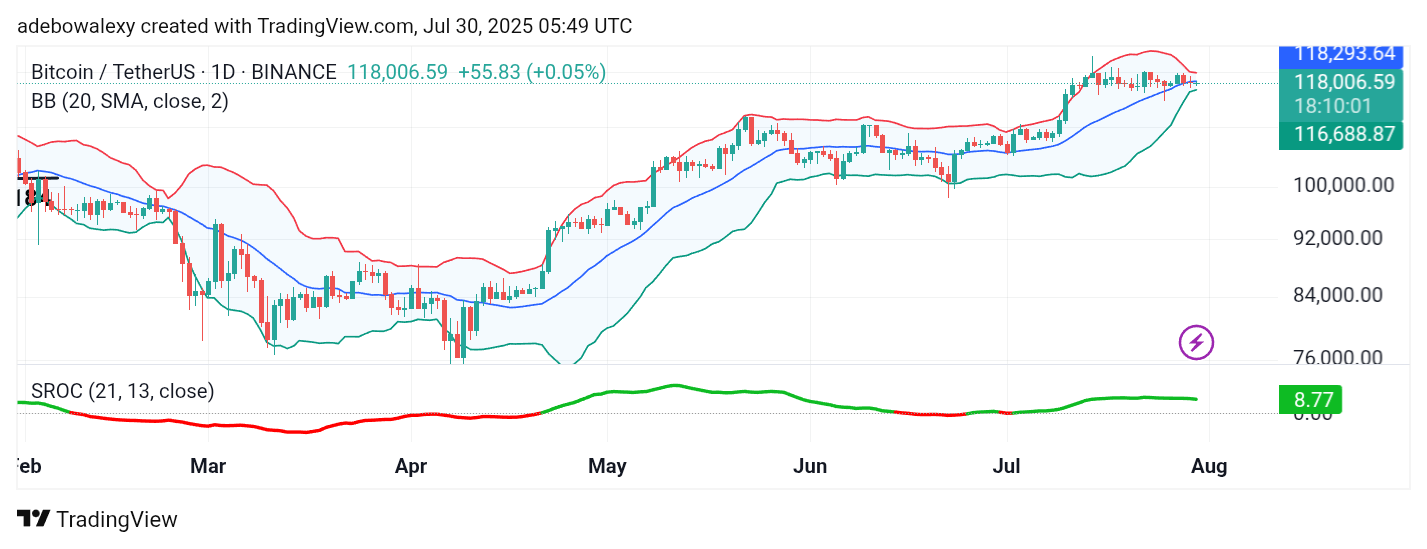
While the ongoing session in the Bitcoin daily market remains in the green, the corresponding price candle is relatively small and has dropped below the middle band of the Bollinger Bands (BB) indicator. Meanwhile, the BB indicator has contracted significantly. The terminal end of the BB has narrowed considerably more than its previous width. Nevertheless, the Smoothed Rate of Change (SROC) indicator line remains above the equilibrium level, maintaining a sideways trajectory.
Bitcoin Price Prediction: BTC/USDT Appears to Be Gathering Momentum
Observations suggest that the $118,000 price level has become a strong support zone for the bulls. This holds true despite price action dipping just below the middle band of the BB indicator. The BB bands continue to narrow, while buying activity persists, suggesting that bullish pressure may be quietly building. The SROC indicator line also moves sideways but remains above the equilibrium level, reinforcing the possibility of continued bullish momentum in upcoming sessions.
Bitcoin Price Prediction: BTC/USDT Bullish Sentiment Holds On (4-Hour Chart)
On the Bitcoin 4-hour chart, buyers appear to dominate much of the market movement. However, the most recent price candle is red and has appeared just below the middle band of the BB indicator.
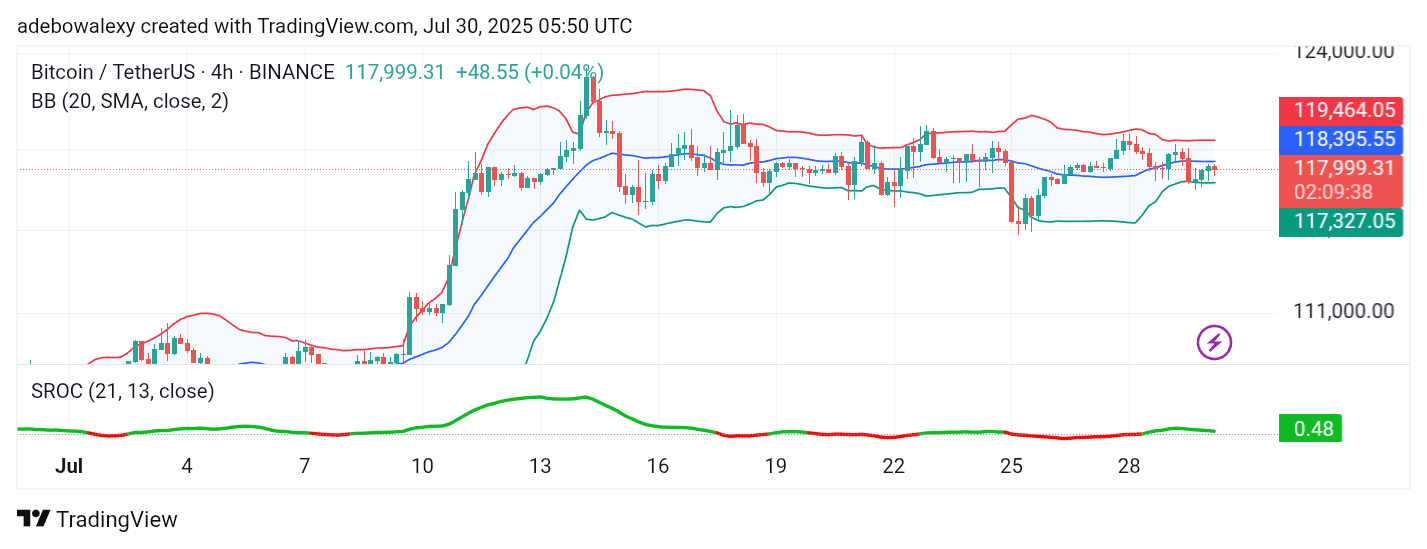
This signals a potential short-term challenge for bullish sentiment. Nonetheless, the BB indicator remains narrow, and the general upward trajectory remains intact. The SROC line also stays above the equilibrium level while moving sideways. Therefore, traders may consider waiting until the market breaks above the middle band of the BB indicator before targeting the $120,000 and $122,500 resistance levels.