Litecoin (LTC) Price Prediction: LTC/USDT Faces Sharp Downward Rejection
Estimated Reading Time: 3 minutes
Don’t invest unless you’re prepared to lose all the money you invest. This is a high-risk investment and you are unlikely to be protected if something goes wrong. Take 2 minutes to learn more

Date: July 29, 2025
Despite Litecoin maintaining a generally upward trend on the daily chart, the market has experienced a notable setback. However, price action still holds at an elevated level, indicating that bullish momentum remains dominant despite recent corrections.
LTC/USDT Long-Term Trend — Bullish (Daily Chart)
Key Price Levels:
Resistance: $110, $115, $120
Support: $105, $100, $95
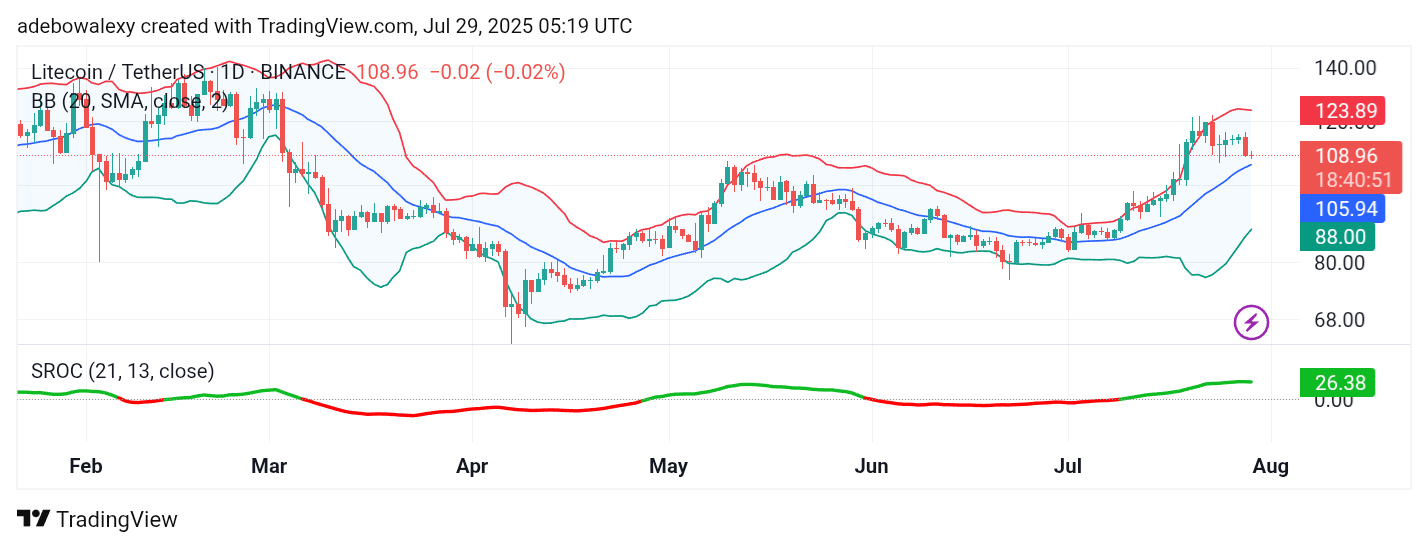
The previous session brought a strong downward correction in the Litecoin market. Although the current session is following a similar path, its momentum appears significantly weaker. The latest price candle remains above the midline of the Bollinger Bands (BB) indicator, which continues to widen and slope upward—an encouraging signal.
Additionally, the Smoothed Rate of Change (SROC) indicator line remains above the equilibrium level, currently standing at 26.38, confirming that underlying bullish strength persists.
Litecoin Price Prediction: LTC/USDT Eyes Higher Targets
Though short-term retracements have occurred on the Litecoin market, the broader trend retains upward potential. The most recent price candle appears as a doji, suggesting indecision in the market and a tug-of-war between buyers and sellers.
Nevertheless, price action continues to hover above the BB midline, and the BB indicator maintains its upward slope—both of which favor bullish prospects. The SROC line also remains above the equilibrium level, further supporting the likelihood of an upward continuation.
Litecoin Price Prediction: LTC/USDT Approaches Local Bottom (4-Hour Chart)
On the Litecoin 4-hour chart, price action has reached the lower band of the Bollinger Bands, typically considered an area of potential reversal. The candles appearing in this region are small, signaling reduced bearish momentum and a possible shift toward consolidation.
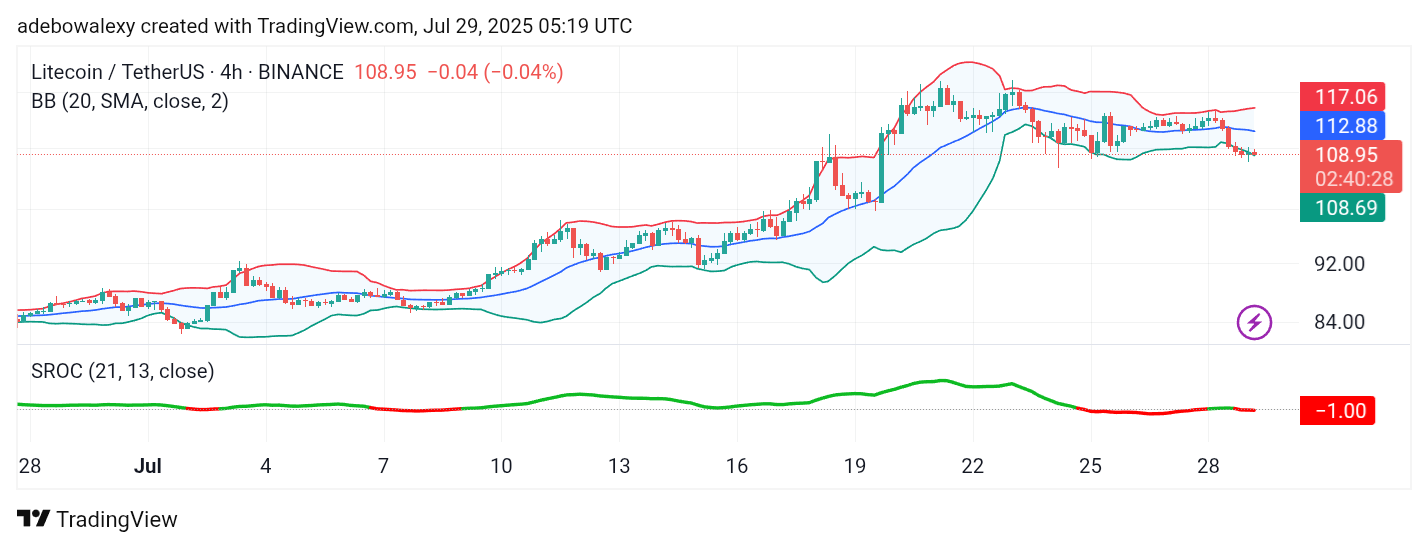
The SROC line has dipped slightly below the equilibrium level, but its terminal end appears to be flattening—indicating that downward momentum may be stalling. This setup suggests the market could be forming a base, and traders may anticipate a potential rebound toward the $115 resistance level.