Dogecoin (DOGE) Price Prediction: DOGE/USDT Reverses Toward Higher Levels
Estimated Reading Time: 2 minutes
Don’t invest unless you’re prepared to lose all the money you invest. This is a high-risk investment and you are unlikely to be protected if something goes wrong. Take 2 minutes to learn more
Date: July 28, 2025
Dogecoin has recently regained strong bullish momentum, propelling the price past the $0.2500 resistance level and briefly approaching the $0.3000 mark. Although bullish momentum eventually faded, leading to a mild retreat, the market overall continues to follow an upward trajectory.
DOGE/USDT Long-Term Trend — Bullish (Daily Chart)
Key Price Levels:
Resistance: $0.2500, $0.3000, $0.5035
Support: $0.2000, $0.1750, $0.1500
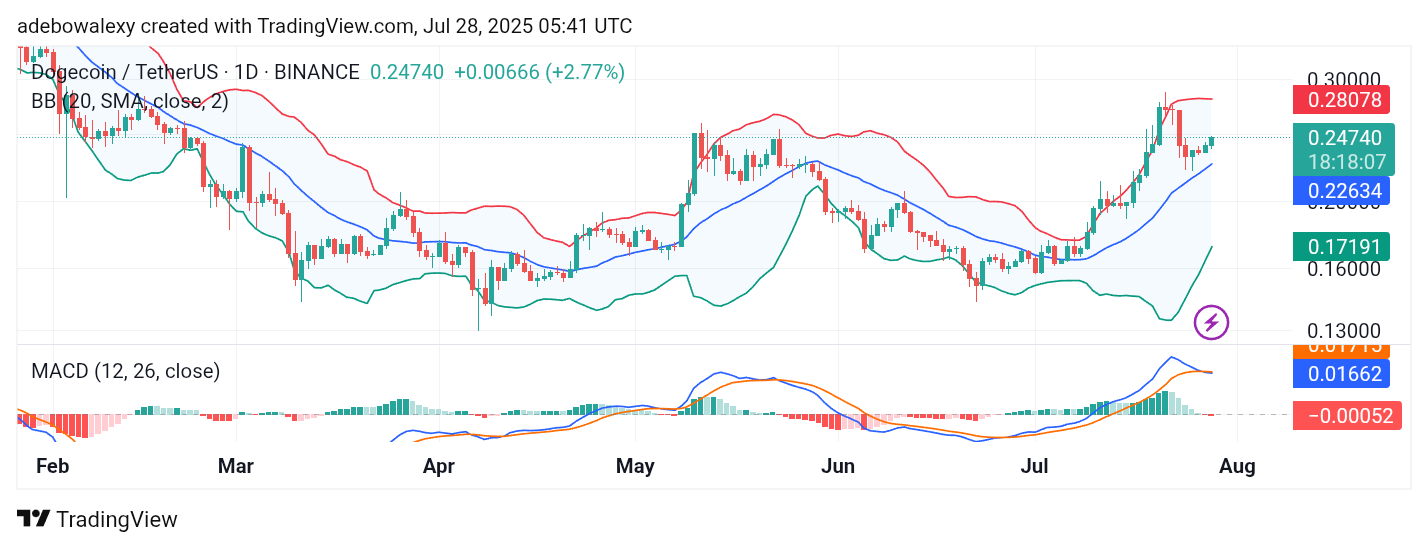
Buying interest appears to have returned to the Dogecoin market. The last two daily candles are green, with the most recent one forming higher than the previous—both positioned above the midline of the Bollinger Bands (BB) indicator. The BB itself is sloping upward, signaling continued bullish pressure.
The Moving Average Convergence Divergence (MACD) indicator lines are currently above the equilibrium level but moving sideways, reflecting the current phase of consolidation following the recent upward crossover.
DOGE/USDT Charts an Upward Course
On the daily chart, Dogecoin price action remains comfortably above the BB midline and the MACD equilibrium. The last two green candles indicate growing buying momentum following a brief pullback. This behavior signals renewed bullish intent among market participants. With the BB indicator pointing upward and MACD lines steady above the baseline, the setup supports the case for further upward movement in the near term.
DOGE/USDT Maintains Bullish Momentum (4-Hour Chart)
On the 4-hour chart, DOGE continues to trend upward. The Bollinger Bands appear significantly narrowed—suggesting reduced volatility—but price action is pressing against the upper band, a bullish sign. The latest candle is green, reinforcing the view that buying activity is ongoing.
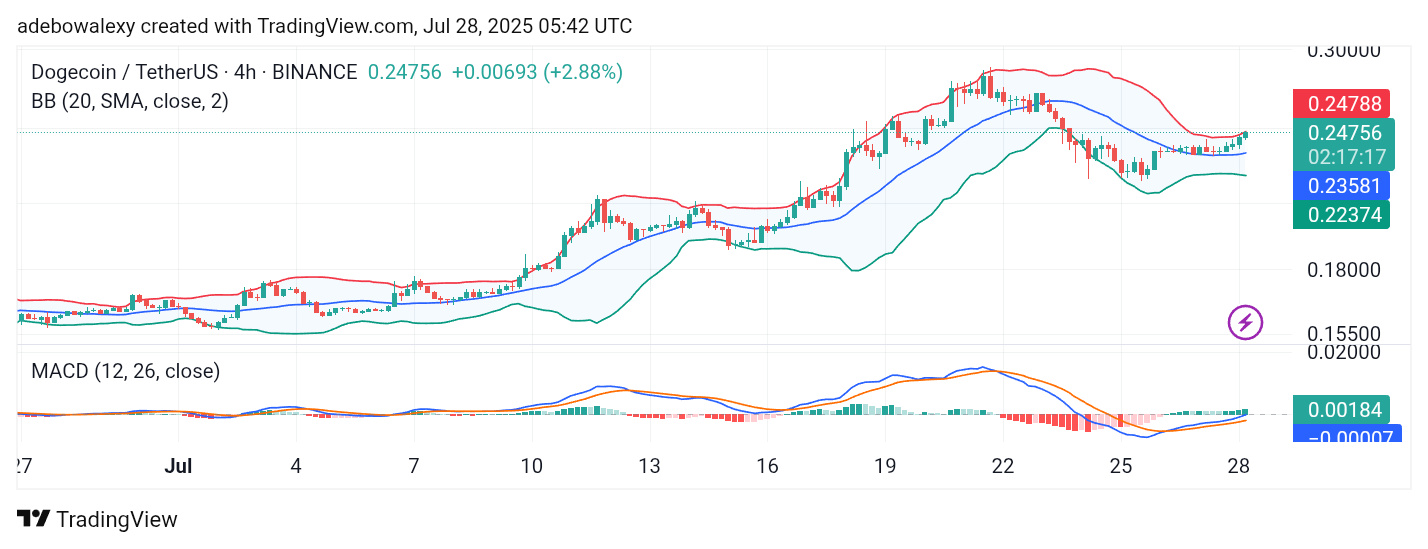
The MACD indicator lines have crossed upward from below the equilibrium level, while the histogram bars are green and above the midline. This confirms upward momentum is building on shorter time frames. Traders may look to the $0.3000 level as the next key target.