Solana (SOL/USD) Trade Is Consolidating, Breaching Barriers
Estimated Reading Time: 4 minutes
Don’t invest unless you’re prepared to lose all the money you invest. This is a high-risk investment and you are unlikely to be protected if something goes wrong. Take 2 minutes to learn more
Solana Price Prediction – December 23
Quite much has been recorded positively in the way that the SOL/USD market buyers have been demonstrating, given that the crypto-economic price has been consolidating, breaching barriers alongside the strengthening process of the upper Bolinger Band.
A significant upward trend has been observed against the upper bound of the Bollinger Band indicators as the market makes a determined attempt to break through most of its recent highs each day, leaving no space for sellers to re-enter a resistance positional order at this point.But it is not the best course of action from a psychological standpoint for purchasers to simply leap at the uprising without taking into account the force’s increasing speed and the distance they must traverse in the event that a swift reversal occurs against such an incursion.
SOL/USD Market
Key Levels:.
Resistance levels:$120, $125, $130
Support levels: $85, $75, $65
SOL/USD – Daily Chart
The SOL/USD daily chart showcases that the crypto-economic market is consolidating in a northward direction, breaching barriers freely.
At this moment, the upper Bollinger Band has been given a smooth northward stretching motion alongside the representation of bullish candlesticks. The probable aggressive reversal of the current may feature a chain of selling candlesticks back to test vital points around or between $85 and $80. The stochastic oscillators are tracing northbound by pointing to the moon side in the overbought region.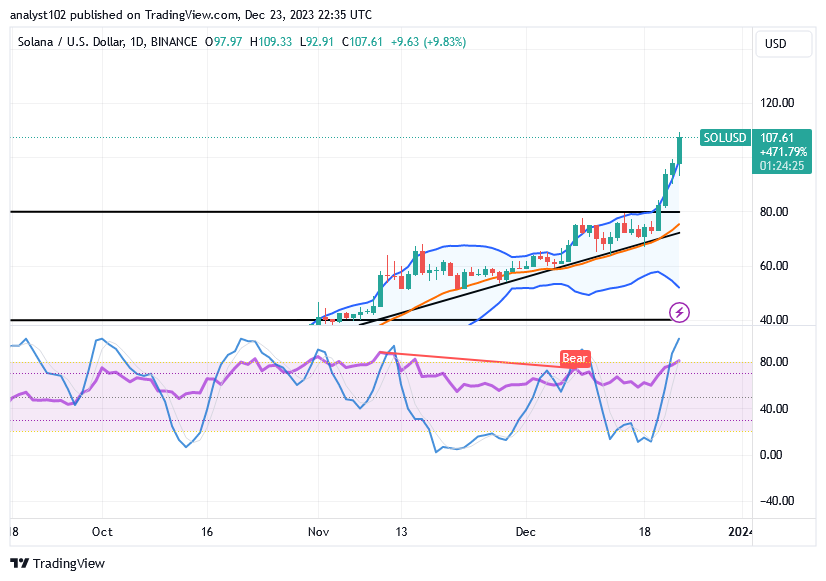
As the SOL/USD price trades below $120, should long-position pushers ignore any likely reversal around the upper Bollinger band trend line?
Considering the capacity pace being executed by the SOL/USD market bulls over time, it would be difficult to stage a point against it, given that the crypto trade is consolidating and breaching barriers toward the resistance line of $120.
To maintain the present upward trend, long-position traders had to keep above the third bullish candlestick that was generated. To put it another way, the idea of purchasing a wall may have been built into the card. However, if the current trade point fails to break the $120 resistance, the price will likely rise farther northward during the current uptrend or in the upcoming session.
Before placing a shorting order, bears are advised to exercise patience and wait for the market to return to a reformation process that is characterized by many rejections at higher zones or an instance of an aggressive reversal movement mode. Investors will also need to withdraw some of their capital if that is the case.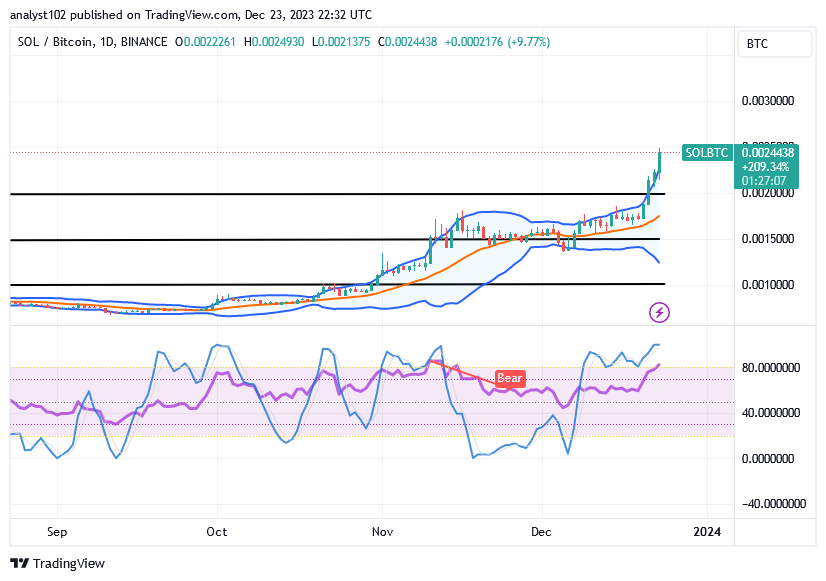
SOL/BTC Price Analysis
In contrast, the Solana market is currently consolidating northwardly versus the point of Bitcoin, breaching barriers.
The Bollinger Bands have been at the top, extending northward in tandem with bullish variation candlesticks to demonstrate that the basic crypto economy is seeing rapid growth. The overbought area of the stochastic oscillators indicates that the cryptocurrency market has been on the verge of collapsing. It is important to remember that the market could quickly begin its required retracement process.
Note: Cryptosignals.org is not a financial advisor. Do your research before investing your funds in any financial asset or presented product or event. We are not responsible for your investing results.
You can purchase Lucky Block here. Buy LBLOCK