Solana (SOL/USD) Price Conjectures, Holding to Hiking Index
Estimated Reading Time: 3 minutes
Don’t invest unless you’re prepared to lose all the money you invest. This is a high-risk investment and you are unlikely to be protected if something goes wrong. Take 2 minutes to learn more
Solana Price Prediction – December 14
A long distance of the technical analysis outlook in the market operation of the SOL/USD has staged a condition, denoting that the crypto-economic trade conjectures a base in the bullish impulse motion that has been playing out, holding to a hiking index.
As can be seen in the area between the upper and middle Bollinger Band trend lines, bears have consistently been unable to sustain reversal pressures against the weight of bulls throughout time. Placers in long positions need to exercise caution when deciding how to make additional upward moves. But the best times for investors to make more money are yet to come.
SOL/USD Market
Key Levels:.
Resistance levels:$80, $90, $100
Support levels: $60, $50, $40
SOL/USD – Daily Chart
The SOL/USD daily chart reveals the crypto-economic price conjectures a base around the line of the middle Bollinger Band, holding to a hiking index.
The stochastic oscillators have penetrated the blue line into the oversold region, forming a smaller bullish candlestick in the making toward the line of the upper Bollinger Band. The overall positional points of the Bollinger Band indicators show that buyers are going to prevail maximally in the operations ahead.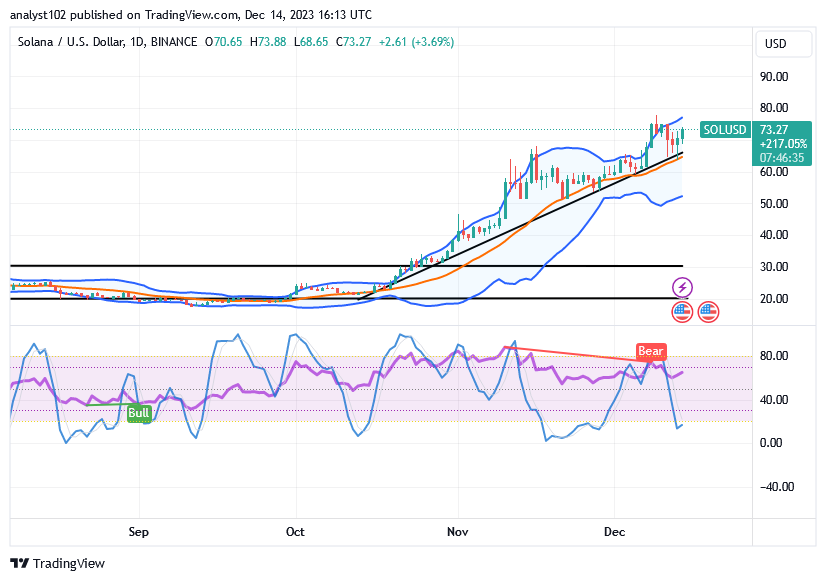
At $73.27, where is the likely resistance line of the current rising force in the SOL/USD market?
There has been ongoing buying pressure in the trade activities of the SOL/USD trade, given that the crypto market conjectures, holding to a hiking index at an average of 3.69%.
Buyers in the market should have moved closer to the middle Bollinger Band’s axis in hopes of a rebound since there were favorable rising motions. It is anticipated that buyers will best push against the upper Bollinger Band by preventing a reversal, which would negate the baseline of today’s trading candlestick, which is located at the $70 mark.
A space has been provided for buyers to exhaust their velocities by featuring an overbought situation, as demonstrated by the stochastic oscillators’ reading posture, in order to project a feasible move toward the reduction process later at greater places.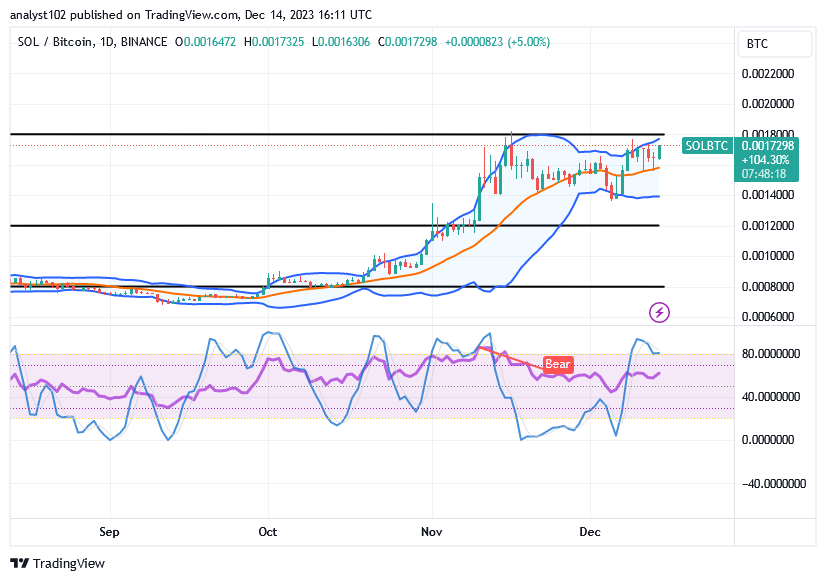
SOL/BTC Price Analysis
In contrast, the Solana trade conjectures against the purchasing stance of Bitcoin, holding to a hiking index around the upper Bollinger Band.
It appears that the stochastic oscillators are attempting to initiate a consolidation action by dipping the blue portion into the overbought area. Indicators for the Bollinger Bands have extended northward to create higher zones, which illustrate the ups and downs that the two cryptocurrencies frequently experience. The majority of the time, positive volatility will be measured as the oscillators return to lower values. As a result, the former instrument can still be suspended before gaining ground in the counter-crypto economy.
Note: Cryptosignals.org is not a financial advisor. Do your research before investing your funds in any financial asset or presented product or event. We are not responsible for your investing results.
You can purchase Lucky Block here. Buy LBLOCK